Median Age
39 Years
Largest Age Group
35-44 Years
Approximately 14% of Residents
Under 20
26%
Over 65
16%

Avg Rent
$1,621
Population
45,151
Renter Mix
39% Rent
Sitting just inside the Capital Beltway in Prince George's County, Lanham puts two major cities within easy reach without the noise or price tag that comes with living in either one. Washington, D.C. is less than 10 miles away, and Baltimore is roughly 30 miles north, making this Maryland community a smart base for anyone who splits time between both. The University of Maryland is about 15 minutes out, adding an academic energy to the area's already busy rhythms. Greenbelt Park, a sprawling national recreational space, offers wooded trails and campgrounds that feel surprisingly removed from the surrounding suburbs.
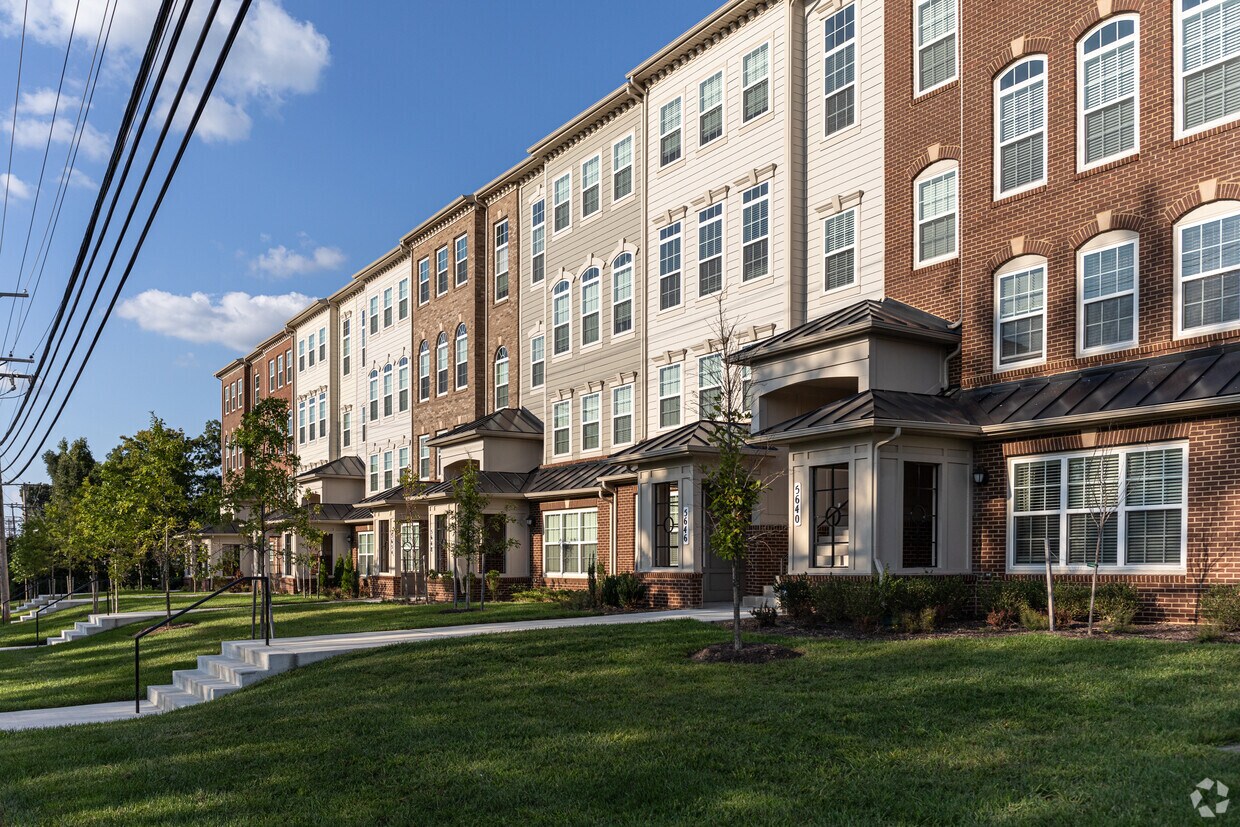
Day-to-day life here leans toward the practical and the convenient. Shopping centers, local dining, and everyday errands are all within a short drive, and commuters appreciate the access to Metro service at New Carrollton Station and MARC rail at Seabrook. The Thomas J. Calloway House, listed on the National Register of Historic Places, adds a layer of historic character to the area. Rental options range from spacious townhomes to well-appointed apartment communities, with layouts that comfortably accommodate studios through four-bedroom floor plans, giving renters plenty of room to find a fit that works for their lifestyle.
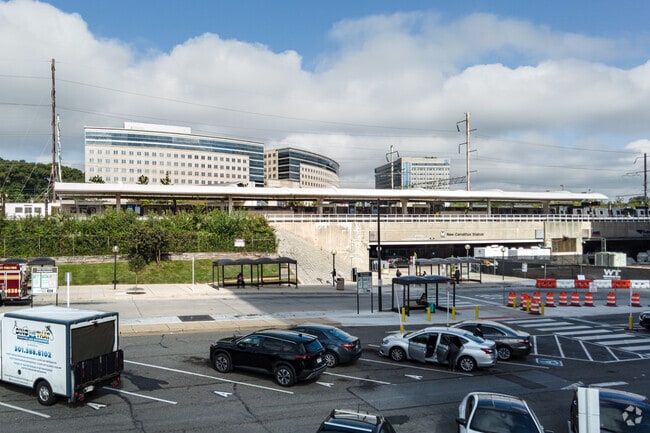
New Carrollton Metro Station connects Lanham to downtown DC, making it commuter-friendly.
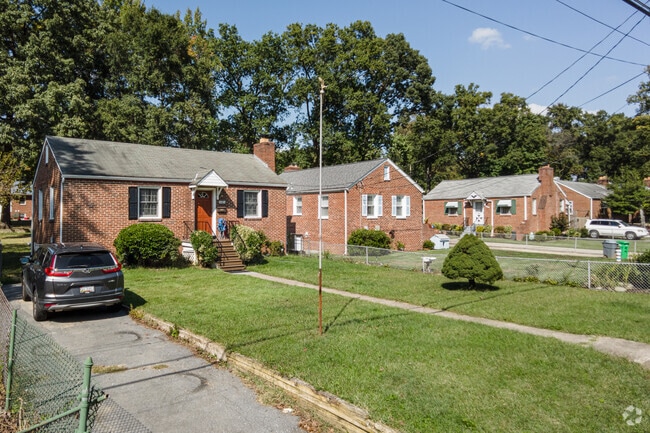
Rows of brick Minimal Traditional homes make up the Lanham area.
Median Household Income
$83,846
Average: $102,593
Education
10,267
Residents Have a Degree
Job Market
24,521
Workers Employed
Median Age
39 Years
Largest Age Group
35-44 Years
Approximately 14% of Residents
Under 20
26%
Over 65
16%
Housing Distribution
Lanham has more homeowners than renters.

Education Distribution
Review this city's overall education levels.

As of July 2026, the average apartment rent in Lanham, MD is $1,747 for a studio, $1,621 for one bedroom, $2,086 for two bedrooms, and $2,164 for three bedrooms. Apartment rent in Lanham has increased by 1.1% in the past year.
Explore how walkable, bikeable, drivable, and transit-friendly Lanham, MD is for everyday living.
Fairly Walkable
Walkability
Limited Public Transit
Transit
Exceptionally Drivable
Drivability
Somewhat Bikeable
Bikeability
Public
Grades K-5
448 Students

Public
Grades PK-5
472 Students

Catherine T. Reed Elementary School
Public
Grades PK-5
472 Students
Public
Grades PK-5
497 Students

Public
Grades PK-5
497 Students
Public
Grades 6-8
1,274 Students

Public
Grades 6-8
1,274 Students
Public
Grades 9-12
2,503 Students
Public
Grades 9-12
2,503 Students
† Our analysis of utilities, groceries, transportation, healthcare, home prices, and other goods and services is sourced from the Cost of Living Index, a respected benchmark published by the Council for Community and Economic Research (C2ER) that provides a thorough overview of living expenses across different regions.
Rent data is provided by CoStar Group’s Market Trend reports. As the industry leader in commercial real estate information, analytics, and news, CoStar conducts extensive research to produce and maintain a comprehensive database of commercial real estate information. We combine this data with public record to provide the most up-to-date rental information available.
Consumer goods, services, and home prices are sourced from the Cost of Living Index published by the Council for Community and Economic Research (C2ER). The data on this page is updated quarterly. It was last published in June 2026.
Demographic information comes from Neustar and combines detailed address data with U.S. Census and American Community Survey statistics to produce reliable local estimates.


