
Westlake Apartments
331 Park Plaza Dr,
Daly City, CA 94015
$1,935 - $3,669 Total Monthly Price
Studio - 3 Beds
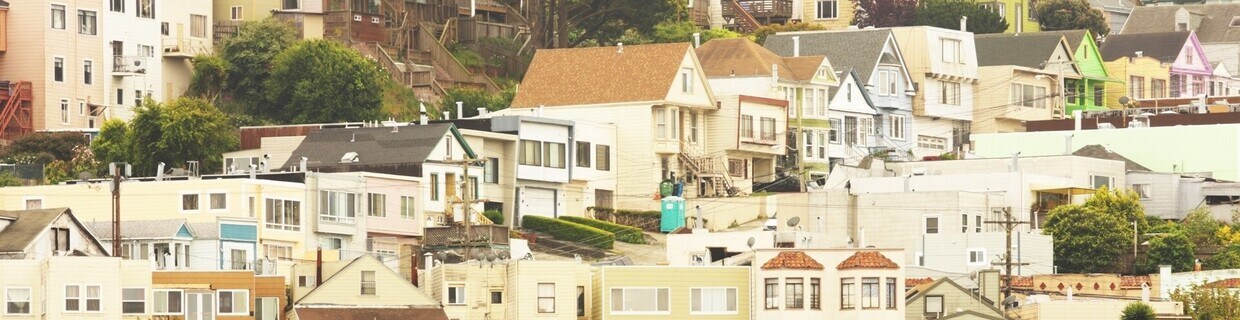


Bordering San Francisco's southern edge, Daly City combines coastal living with metropolitan convenience. The city's distinctive neighborhoods include Westlake, known for its mid-century architecture that inspired Pete Seeger's "Little Boxes," and established areas like Serramonte, St. Francis Heights, and the historic Top of the Hill district. The rental market shows stability, with one-bedroom apartments averaging $2,327 and three-bedroom units at $3,742.
Residents enjoy outdoor recreation at San Bruno Mountain State Park and shopping at Serramonte Center and Westlake Shopping Center, both offering complimentary parking. The historic Cow Palace, a Bay Area landmark since 1941, continues to host major events. Transportation options include multiple BART stations connecting to San Francisco and the greater Bay Area. The city's significant Filipino American community has shaped local culture, particularly evident in the area's diverse dining options. The moderate climate, characterized by cooling fog and mild temperatures year-round, provides a comfortable alternative to San Francisco's microclimate variations.
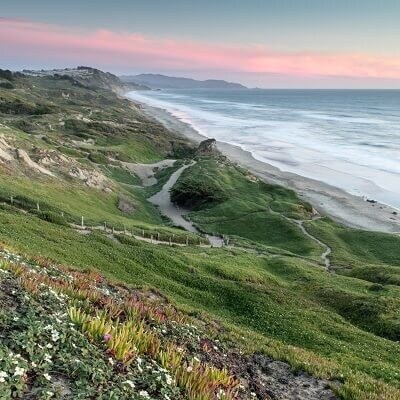
An aerial view of Mussel Rock Park in Daly City
The Summit Loop Trail leads to the top of San Bruno Mountain
As of February 2026, the average apartment rent in Daly City, CA is $2,152 for a studio, $2,419 for one bedroom, $3,115 for two bedrooms, and $3,943 for three bedrooms. Apartment rent in Daly City has increased by 3.5% in the past year.
Very Walkable
out of 100 WalkScore® Rating
If you enjoy walking, you’ll enjoy renting in this area! It’s a very walkable neighborhood.
Good Transit
out of 100 TransitScore® Rating
The area around this property has good transit with many nearby transportation options.
Somewhat Bikeable
out of 100 BikeScore® Rating
You might be able to find places to ride your bike in this area, but you’ll most likely want your car for most errands.
Public
Grades K-5
299 Students

Public
Grades K-5
286 Students
Public
Grades K-5
366 Students

Public
Grades K-5
294 Students
Public
Grades K-5
407 Students

Public
Grades 6-8
558 Students
Public
Grades K-8
342 Students

Public
Grades 6-8
588 Students

Franklin Delano Roosevelt Elementary
Public
Grades K-8
294 Students

Public
Grades 9-12
1,278 Students
Public
Grades 9-12
1,072 Students

3,466
Communities
953,670
Units
893
Cities

636
Communities
126,351
Units
249
Cities
65
Communities
10,535
Units
31
Cities

157
Communities
49,565
Units
95
Cities

53
Communities
7,083
Units
41
Cities

87
Communities
7,822
Units
33
Cities
† Our analysis of utilities, groceries, transportation, healthcare, home prices, and other goods and services is sourced from the Cost of Living Index, a respected benchmark published by the Council for Community and Economic Research (C2ER) that provides a thorough overview of living expenses across different regions.
Rent data is provided by CoStar Group’s Market Trend reports. As the industry leader in commercial real estate information, analytics, and news, CoStar conducts extensive research to produce and maintain a comprehensive database of commercial real estate information. We combine this data with public record to provide the most up-to-date rental information available.
Consumer goods, services, and home prices are sourced from the Cost of Living Index published by the Council for Community and Economic Research (C2ER). The data on this page is updated quarterly. It was last published in February 2026.


