Median Age
43 Years
Largest Age Group
45-54 Years
Approximately 16% of Residents
Under 20
24%
Over 65
18%
Area Guide
Avg Rent
$3,484
Population
56,411
Renter Mix
42% Rent
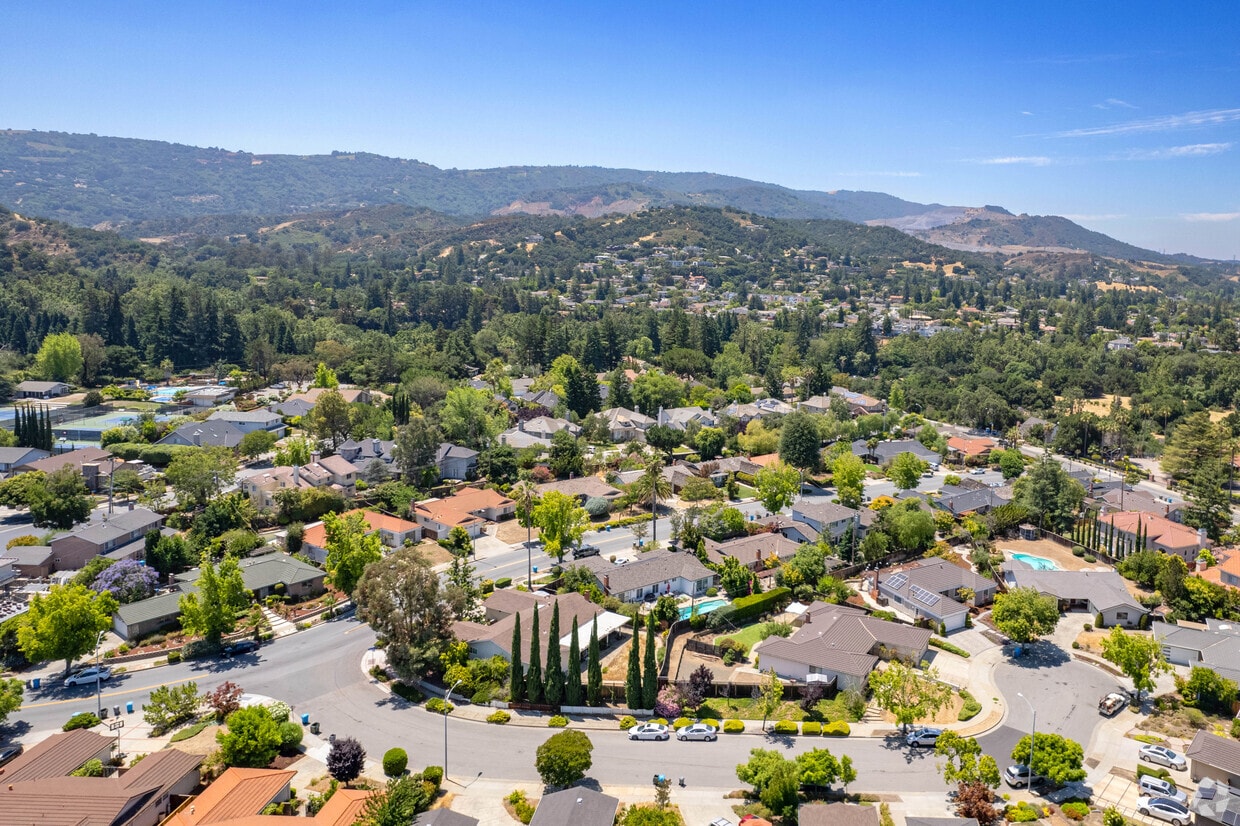
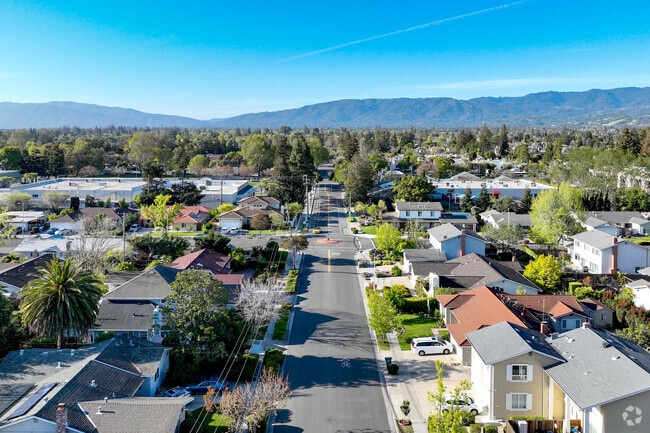
Located in the heart of Silicon Valley, Cupertino combines suburban living with technological advancement. The city, home to Apple Inc.'s distinctive Apple Park headquarters, features tree-lined streets and rolling foothills. Housing includes apartments, townhouses, and single-family homes throughout various neighborhoods. Current rental data shows one-bedroom apartments averaging $3,138 per month, while three-bedroom units average $4,994.
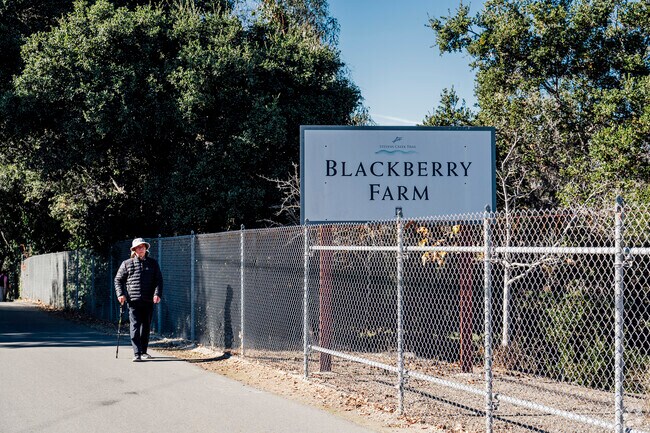
The city features De Anza College, set on a 112-acre campus. Outdoor enthusiasts can explore the Stevens Creek Trail, which winds through McClellan Ranch Park and Blackberry Farm. Memorial Park hosts community events and concerts throughout the year. The Cupertino Library serves as a central resource for residents, ranking as Santa Clara County's most active branch. The area's history dates back to Spanish exploration, when the region was named after Arroyo San José de Cupertino, a creek named in honor of Saint Joseph of Cupertino.
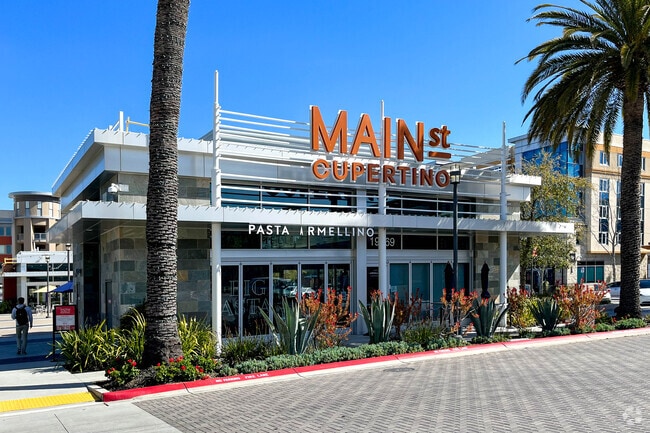
Take a tour through Main Street Cupertino to experience trendy dining and dessert spots.
Blackberry Farm is a great place to take hikes in Cupertino.
Stevens Creek County Park is a cyclist's paradise for uphill and scenic views when they ride.
McClellan Ranch Preserve offers beautiful scenery for your next walk or run.
Cupertino sits just minutes from Apple’s stunning campus.
Median Household Income
$214,598
Average: $211,489
Education
32,883
Residents Have a Degree
Job Market
28,032
Workers Employed
Median Age
43 Years
Largest Age Group
45-54 Years
Approximately 16% of Residents
Under 20
24%
Over 65
18%
Housing Distribution
Cupertino has more homeowners than renters.

Education Distribution
Review this city's overall education levels.

As of June 2026, the average apartment rent in Cupertino, CA is $2,714 for a studio, $3,493 for one bedroom, $4,422 for two bedrooms, and $5,570 for three bedrooms. Apartment rent in Cupertino has increased by 6.3% in the past year.
Explore how walkable, bikeable, drivable, and transit-friendly Cupertino, CA is for everyday living.
Somewhat Walkable
Walkability
Minimal Public Transit
Transit
Exceptionally Drivable
Drivability
Fairly Bikeable
Bikeability
Public
Grades K-5
662 Students

Abraham Lincoln Elementary School
Public
Grades K-5
662 Students
Public
Grades K-5
489 Students
Public
Grades K-5
452 Students
Public
Grades K-5
407 Students
Public
Grades 6-8
841 Students

Public
Grades 6-8
800 Students
Public
Grades 6-8
800 Students
Public
Grades 6-8
880 Students
Public
Grades 6-8
880 Students
Public
Grades 9-12
2,224 Students
Public
Grades 9-12
2,224 Students
Public
Grades 9-12
1,800 Students
Public
Grades 9-12
1,800 Students
Public
Grades 9-12
1,630 Students
† Our analysis of utilities, groceries, transportation, healthcare, home prices, and other goods and services is sourced from the Cost of Living Index, a respected benchmark published by the Council for Community and Economic Research (C2ER) that provides a thorough overview of living expenses across different regions.
Rent data is provided by CoStar Group’s Market Trend reports. As the industry leader in commercial real estate information, analytics, and news, CoStar conducts extensive research to produce and maintain a comprehensive database of commercial real estate information. We combine this data with public record to provide the most up-to-date rental information available.
Consumer goods, services, and home prices are sourced from the Cost of Living Index published by the Council for Community and Economic Research (C2ER). The data on this page is updated quarterly. It was last published in June 2026.
Demographic information comes from Neustar and combines detailed address data with U.S. Census and American Community Survey statistics to produce reliable local estimates.


