Median Age
38 Years
Largest Age Group
30-39 Years
Approximately 20% of Residents
Under 20
22%
Over 65
14%

Avg Rent
$3,169
Population
151,084
Renter Mix
57% Rent
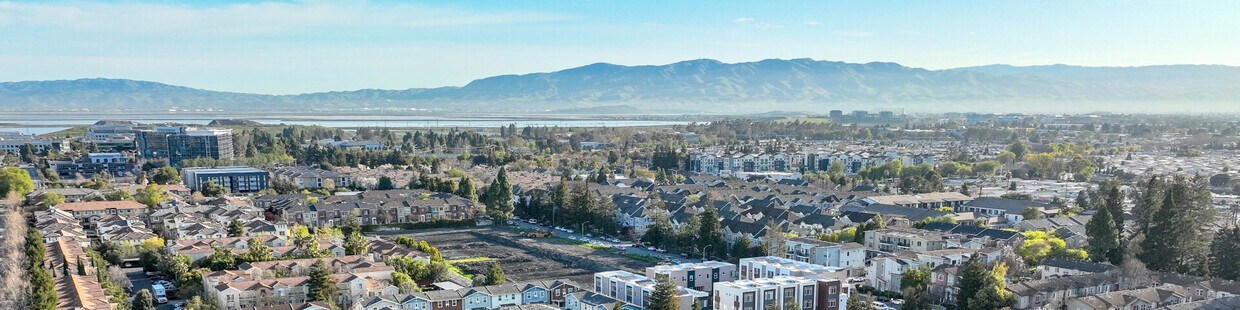
Sunnyvale spans 22 square miles in the heart of Silicon Valley, offering residents a comfortable suburban setting with strong ties to the tech industry. Tree-lined streets connect neighborhoods to outdoor spaces like Baylands Park and Las Palmas Park. Downtown Sunnyvale continues to grow, featuring local dining options alongside an AMC Theatres complex and Whole Foods Market. Housing includes distinctive mid-century Eichler homes and apartment communities throughout the city. Current rental trends show one-bedroom apartments averaging $2,855 per month and two-bedrooms at $3,635, reflecting year-over-year increases of 3.3% and 4.5% respectively.
The city maintains strong connections to both its past and future. The Heritage District and Heritage Park Museum preserve Sunnyvale's agricultural history, while major tech companies maintain significant operations throughout the city. Two Caltrain stations and VTA light rail provide public transportation options for residents. The city's Department of Public Safety, established in 1950, continues its innovative approach with officers trained as police, firefighters, and EMTs. Sunnyvale also holds a special place in technology history - the first successful coin-operated video game, Pong, made its debut here in 1972.
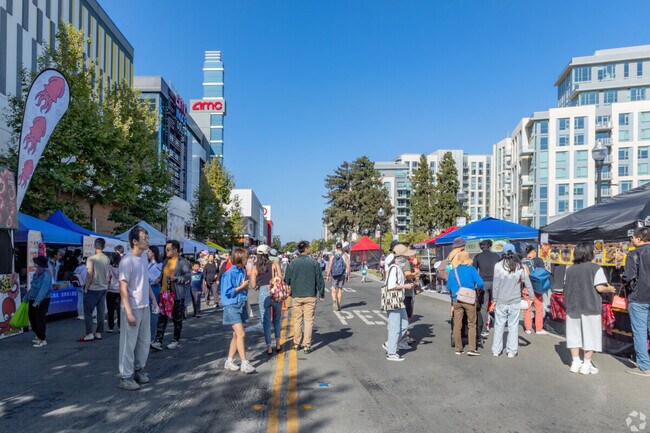
Sunnyvale Mid-Autumn Festival is the largest food and entertainment festival.
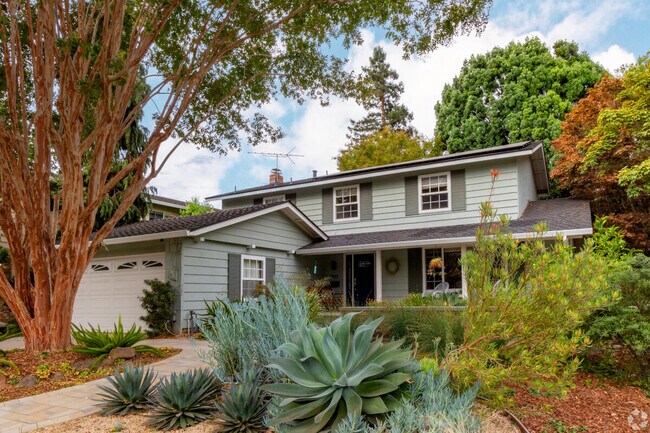
Mediterranean-inspired homes are plentiful in Sunnyvale.
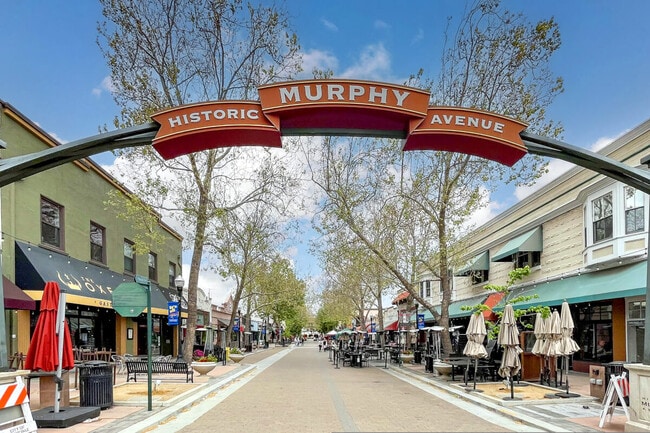
Historic Murphy Avenue is a charming town center bustling with restaurants in Sunnyvale West.
Median Household Income
$171,639
Average: $189,623
Education
79,415
Residents Have a Degree
Job Market
85,755
Workers Employed
Median Age
38 Years
Largest Age Group
30-39 Years
Approximately 20% of Residents
Under 20
22%
Over 65
14%
Housing Distribution
Sunnyvale has more renters than homeowners.

Education Distribution
Review this city's overall education levels.

As of July 2026, the average apartment rent in Sunnyvale, CA is $2,794 for a studio, $3,174 for one bedroom, $4,029 for two bedrooms, and $4,889 for three bedrooms. Apartment rent in Sunnyvale has increased by 7.9% in the past year.
The cost of living in Sunnyvale, CA is 128.8% higher than the national average. Generally, housing in Sunnyvale is 371.6% more expensive than the national average, with rent falling between $2,794 - $4,889. You can expect to pay 42.8% more for groceries, 11.1% more for utilities, and 30.1% more for transportation.
Compare Cities
Explore how walkable, bikeable, drivable, and transit-friendly Sunnyvale, CA is for everyday living.
Fairly Walkable
Walkability
Some Public Transit
Transit
Exceptionally Drivable
Drivability
Moderately Bikeable
Bikeability
Louis E. Stocklmeir Elementary
Public
Grades K-5
840 Students

Louis E. Stocklmeir Elementary School
Public
Grades K-5
840 Students
Cherry Chase Elementary School
Public
Grades K-5
622 Students
Public
Grades K-5
622 Students
Public
Grades K-5
586 Students
Public
Grades 6-12
643 Students
Public
Grades 6-8
1,067 Students

Public
Grades 6-8
1,067 Students
Public
Grades 6-8
1,053 Students
Marian A. Peterson Middle School
Public
Grades 6-8
759 Students
Public
Grades 6-12
643 Students
Public
Grades 9-12
2,060 Students
Public
Grades 9-12
2,060 Students
Public
Grades 9-12
6 Students

† Our analysis of utilities, groceries, transportation, healthcare, home prices, and other goods and services is sourced from the Cost of Living Index, a respected benchmark published by the Council for Community and Economic Research (C2ER) that provides a thorough overview of living expenses across different regions.
Rent data is provided by CoStar Group’s Market Trend reports. As the industry leader in commercial real estate information, analytics, and news, CoStar conducts extensive research to produce and maintain a comprehensive database of commercial real estate information. We combine this data with public record to provide the most up-to-date rental information available.
Consumer goods, services, and home prices are sourced from the Cost of Living Index published by the Council for Community and Economic Research (C2ER). The data on this page is updated quarterly. It was last published in June 2026.
Demographic information comes from Neustar and combines detailed address data with U.S. Census and American Community Survey statistics to produce reliable local estimates.


