Median Age
38 Years
Largest Age Group
30-39 Years
Approximately 17% of Residents
Under 20
23%
Over 65
16%


Avg Rent
$1,441
Population
43,746
Renter Mix
52% Rent
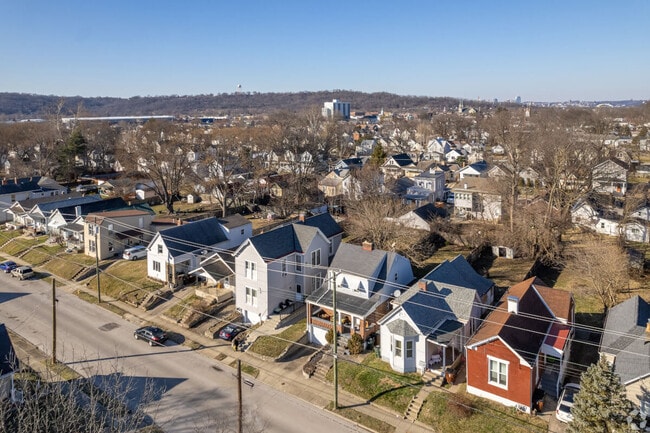
Covington is a vibrant suburban city located directly across the Ohio River from Cincinnati. The north side of the city is well known for its stunning historic architecture, from the numerous magnificent churches to the iconic John A. Roebling Suspension Bridge (connecting Covington with Cincinnati) to the brick townhomes of the Mutter Gottes Historic District. Farther south, things spread out considerably as the urban layout begins to blend into the surrounding countryside.
The local rental market is huge and diverse, ranging from upscale historic homes and swanky downtown condos to sensible suburban homes to budget-friendly efficiency apartments. The variety of housing options combined with the easy access to Cincinnati has bade Covington a longtime favorite for commuters, and frequent travelers will love the close proximity to Cincinnati/Northern Kentucky International Airport.
The Roebling Murals in Downtown Covington tell the history of the region from 8000 B.C. to 2008.
Covington offers big-city benefits in a walkable community that oozes small-town charm.
The water view at George Rogers Clark Park.
Median Household Income
$51,783
Average: $71,645
Education
11,522
Residents Have a Degree
Job Market
22,036
Workers Employed
Median Age
38 Years
Largest Age Group
30-39 Years
Approximately 17% of Residents
Under 20
23%
Over 65
16%
Housing Distribution
Covington has more renters than homeowners.

Education Distribution
Review this city's overall education levels.

As of August 2026, the average apartment rent in Covington, KY is $1,369 for a studio, $1,440 for one bedroom, $1,911 for two bedrooms, and $1,633 for three bedrooms. Apartment rent in Covington has increased by 1.8% in the past year.
The cost of living in Covington, KY is 12.9% lower than the national average. Generally, housing in Covington is 27.9% less expensive than the national average, with rent falling between $1,369 - $1,911. You can expect to pay 10.8% less for groceries, 6.7% less for utilities, and 2.2% more for transportation.
Compare Cities
Explore how walkable, bikeable, drivable, and transit-friendly Covington, KY is for everyday living.
Somewhat Walkable
Walkability
Limited Public Transit
Transit
Exceptionally Drivable
Drivability
Somewhat Bikeable
Bikeability
Public
Grades PK-5
521 Students

Public
Grades PK-5
480 Students

Ryland Heights Elementary School
Public
Grades PK-5
448 Students
Glenn O Swing Elementary School
Public
Grades K-5
400 Students

John G Carlisle Elementary School
Public
Grades K-5
336 Students
Public
Grades 6-8
619 Students

Public
Grades K-12
11 Students
Public
Grades K-12

Public
Grades 9-12
862 Students

Public
Grades K-12
11 Students
Chapman Vocational Education Center
Public
Grades 9-12
Public
Grades K-12
† Our analysis of utilities, groceries, transportation, healthcare, home prices, and other goods and services is sourced from the Cost of Living Index, a respected benchmark published by the Council for Community and Economic Research (C2ER) that provides a thorough overview of living expenses across different regions.
Rent data is provided by CoStar Group’s Market Trend reports. As the industry leader in commercial real estate information, analytics, and news, CoStar conducts extensive research to produce and maintain a comprehensive database of commercial real estate information. We combine this data with public record to provide the most up-to-date rental information available.
Consumer goods, services, and home prices are sourced from the Cost of Living Index published by the Council for Community and Economic Research (C2ER). The data on this page is updated quarterly. It was last published in June 2026.
Demographic information comes from Neustar and combines detailed address data with U.S. Census and American Community Survey statistics to produce reliable local estimates.


