Median Age
44 Years
Largest Age Group
40-49 Years
Approximately 14% of Residents
Under 20
23%
Over 65
21%
Avg Rent
$2,037
Population
41,644
Renter Mix
19% Rent
Buffalo Grove is a village straddling Lake and Cook Counties, about 35 miles northwest of Downtown Chicago and 15 miles north of O'Hare International Airport. The village takes its name from the Potawatomi word for Buffalo Creek, which still winds through parts of the community today. If you're searching for apartments for rent in Buffalo Grove, you'll find a well-established suburb with a population of over 41,000, a median household income above $120,000, and easy access to major employment centers and attractions across the Chicago metro area. Renters here have a solid mix of housing to choose from, including garden-style apartment communities and townhome-style rentals tucked into tree-lined neighborhoods. Shopping and dining are close by at Buffalo Grove Towne Center and Highland Oaks Plaza, with everyday retail just a short drive away. Outdoors, Buffalo Creek and the Des Plaines River Trail & Greenway offer room to walk, jog, and explore, along with several parks and golf courses throughout the village. The College of Lake County's Southlake campus is about four miles away, and both Harper College and Lake Forest College are within 15 miles, making Buffalo Grove a practical base for anyone pursuing continuing education. Getting around is easy. The Buffalo Grove Metra station, less than a mile from the village center, connects commuters to Chicago's Union Station in about an hour. Prairie View Station offers another nearby stop on the same line. Drivers can reach I-294 via Illinois Route 83 or Lake Cook Road, putting the broader metro area within range. O'Hare is roughly 22 miles away, and Midway is about an hour's drive. Whether you're commuting into the city or staying local, Buffalo Grove delivers the suburban setting and the connections to back it up.
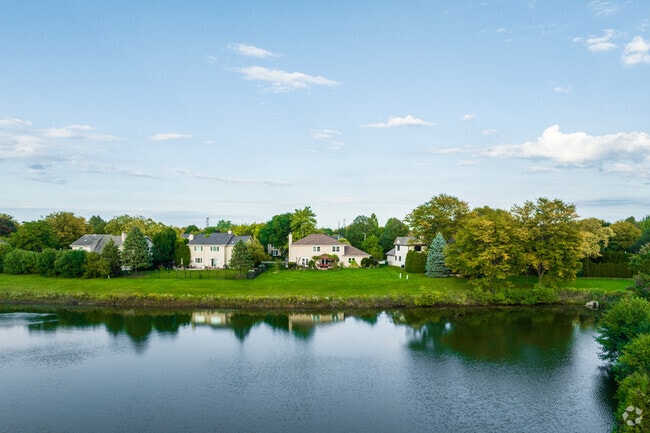
Several homes in Westchester Estates are right by the water of Hidden Lake.
Westchester Estates is a wonderful neighborhood in Buffalo Grove, Illinois.
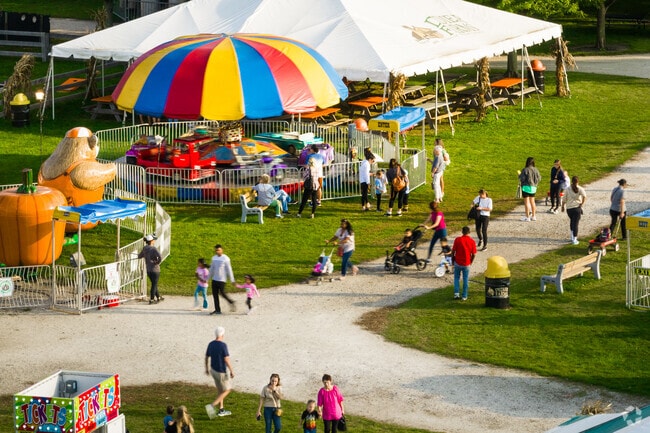
Happy Times Pumpkin Fest features fun carnival rides for family entertainment.
Buffalo Grove Metra station provides a convenient travel option for residents of Buffalo Grove.
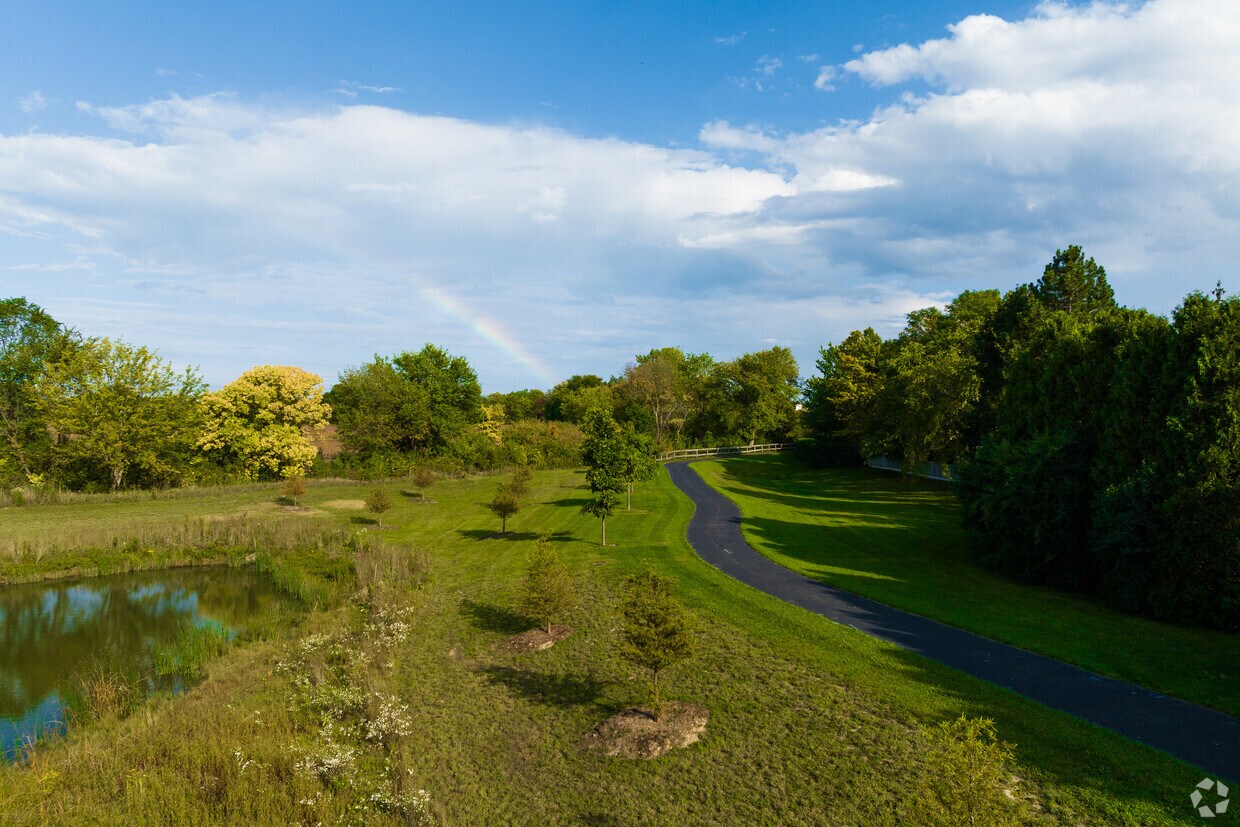
Renier Park in Buffalo Grove features a covered picnic area to enjoy views of the lake.
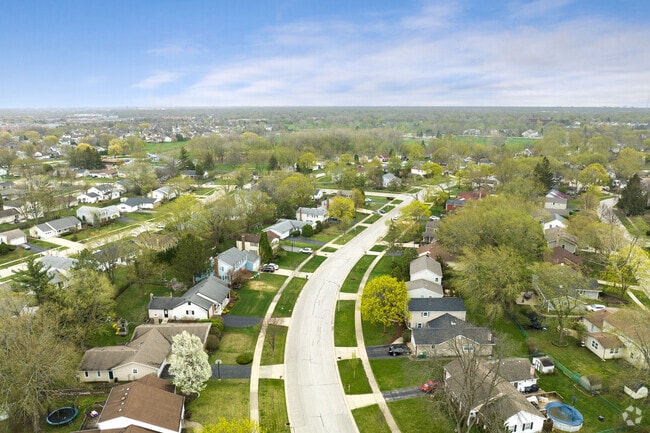
Ridgewood is a smaller neighborhood pocket, but is never far from scenic parks.
Median Household Income
$123,170
Average: $147,807
Education
20,826
Residents Have a Degree
Job Market
23,168
Workers Employed
Median Age
44 Years
Largest Age Group
40-49 Years
Approximately 14% of Residents
Under 20
23%
Over 65
21%
Housing Distribution
Buffalo Grove has more homeowners than renters.

Education Distribution
Review this city's overall education levels.

As of July 2026, the average apartment rent in Buffalo Grove, IL is $2,033 for one bedroom, $2,489 for two bedrooms, and $2,754 for three bedrooms. Apartment rent in Buffalo Grove has increased by 1.0% in the past year.
Explore how walkable, bikeable, drivable, and transit-friendly Buffalo Grove, IL is for everyday living.
Fairly Walkable
Walkability
Limited Public Transit
Transit
Very Drivable
Drivability
Moderately Bikeable
Bikeability
Public
Grades K-5
483 Students

Public
Grades K-5
478 Students
Public
Grades K-5
440 Students
Public
Grades K-5
437 Students
Public
Grades PK-5
696 Students

Public
Grades 6-8
931 Students
Public
Grades 6-8
627 Students
Public
Grades 6-8
712 Students

Public
Grades 9-12
1,914 Students
† Our analysis of utilities, groceries, transportation, healthcare, home prices, and other goods and services is sourced from the Cost of Living Index, a respected benchmark published by the Council for Community and Economic Research (C2ER) that provides a thorough overview of living expenses across different regions.
Rent data is provided by CoStar Group’s Market Trend reports. As the industry leader in commercial real estate information, analytics, and news, CoStar conducts extensive research to produce and maintain a comprehensive database of commercial real estate information. We combine this data with public record to provide the most up-to-date rental information available.
Consumer goods, services, and home prices are sourced from the Cost of Living Index published by the Council for Community and Economic Research (C2ER). The data on this page is updated quarterly. It was last published in June 2026.
Demographic information comes from Neustar and combines detailed address data with U.S. Census and American Community Survey statistics to produce reliable local estimates.


