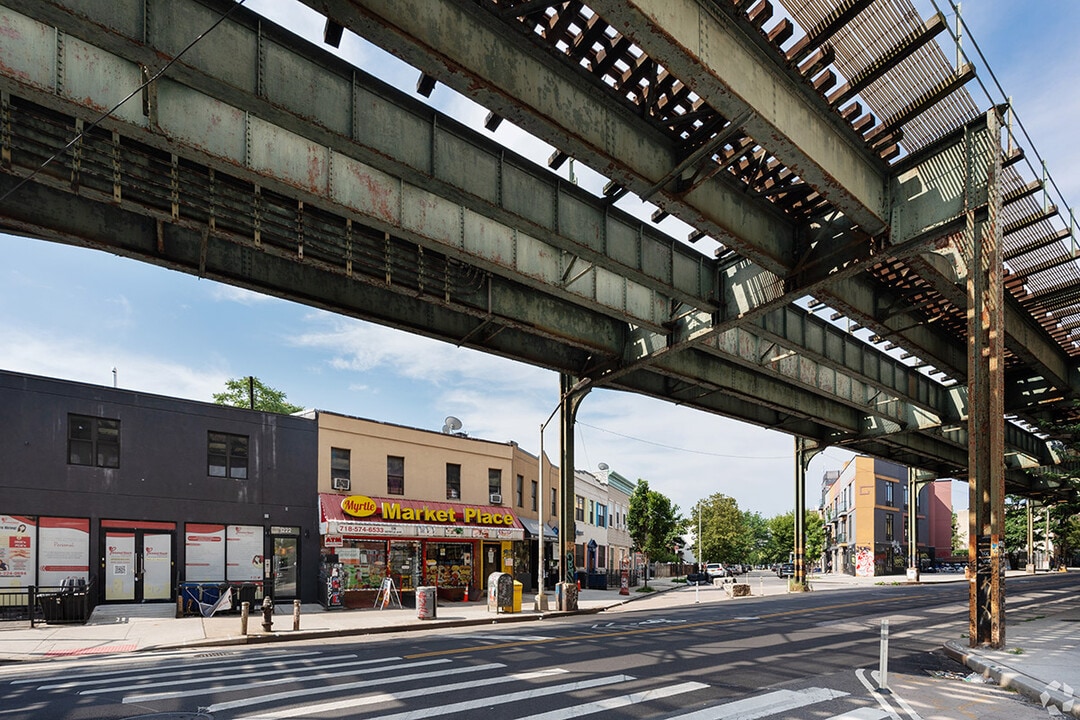
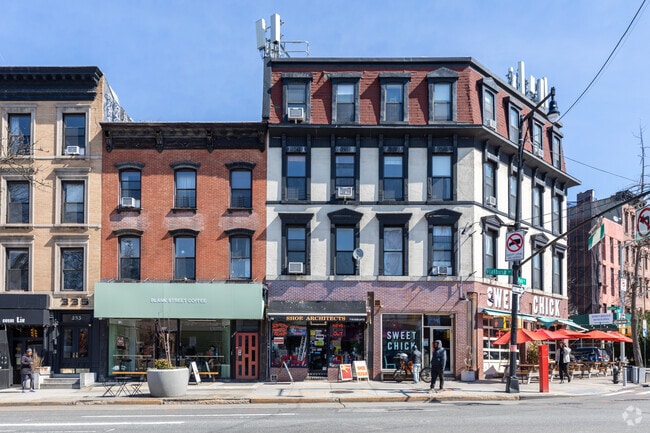
5 Most Affordable Neighborhoods in Brooklyn, NY
Experience all Brooklyn offers without breaking the bank. Explore our detailed guide to moving to Brooklyn on a budget.
Avg Rent
$3,062
Population
2,504,149
Renter Mix
75% Rent
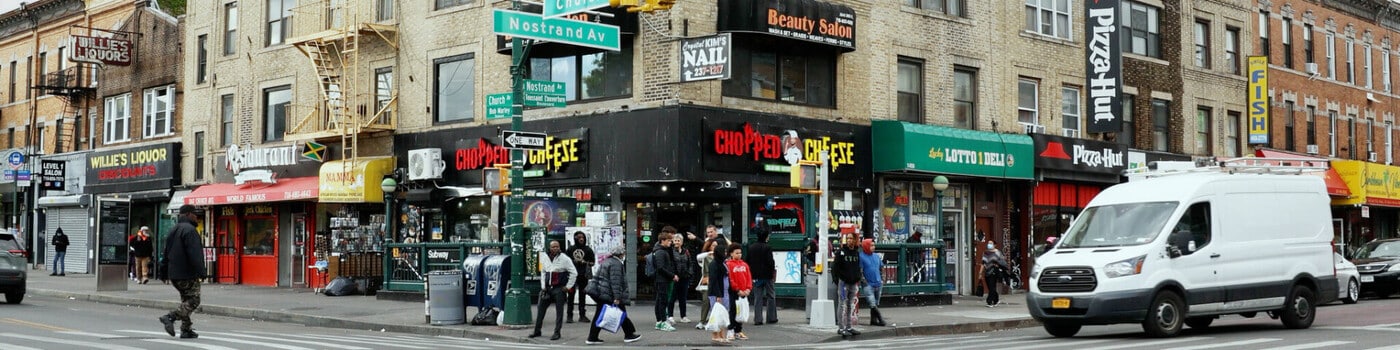
Home to more than 2.6 million residents, Brooklyn is busy, diverse, and constantly growing. Living in Brooklyn gives you access to art, culture, international cuisine, and yearly celebrations. The borough is packed with bars, pop-up art galleries, boutiques, symphony halls, and museums.
Even though Brooklyn is fast-paced and trendy, it is still less expensive than living in New York City. You can save about 10 percent by choosing to rent in Brooklyn over other New York City locales. For example, a one-bedroom apartment in Brooklyn will cost you an average of $2,256. In New York City, a one-bedroom averages $5,813. However, Brooklyn is far from cheap. In fact, it’s one of the most expensive cities in the nation, with the average house costing about $750,000, compared to the national average of $428,000.
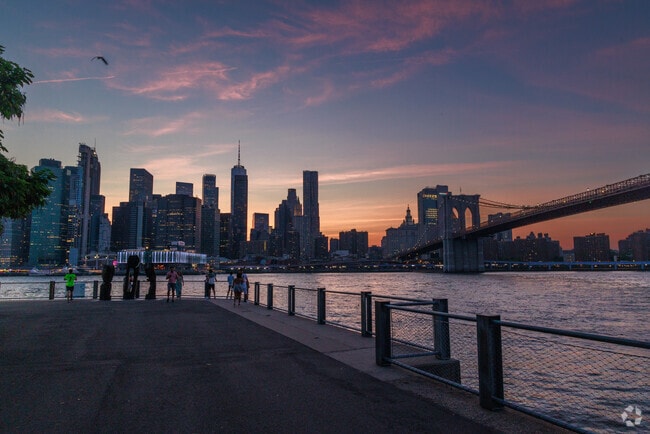
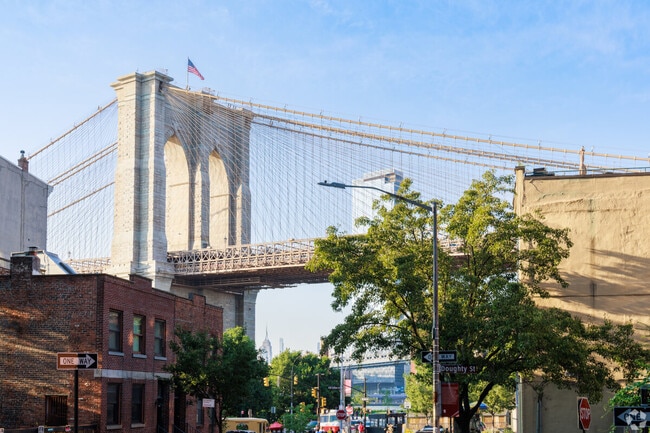
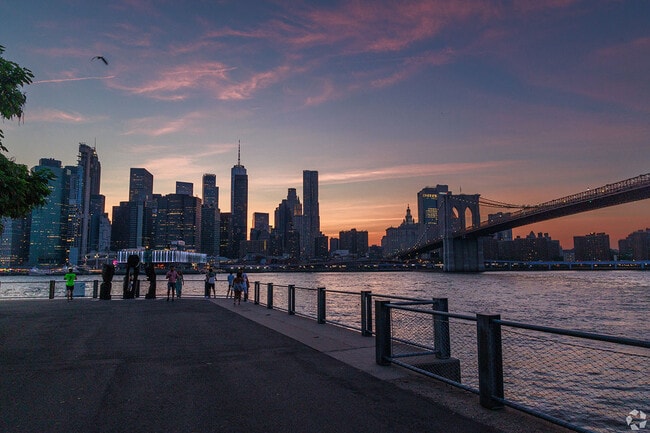
Cost aside, Brooklyn continues to attract new residents because of its location on the waterfront, endless supply of things to do, easy access to the subway, unparalleled walkability, amazing architecture that includes iconic brownstones, and terrific food. You’ll live in a place famous for attractions like the Brooklyn Bridge, Coney Island, and Prospect Park.
The Brooklyn scenery is also grand, containing some of New York’s most attractive parks and landmarks like Grand Army Plaza, the Brooklyn Museum, and the Brooklyn Botanic Garden. If you’re craving a bite of the Big Apple, living in Brooklyn will put you in the heart of it all.
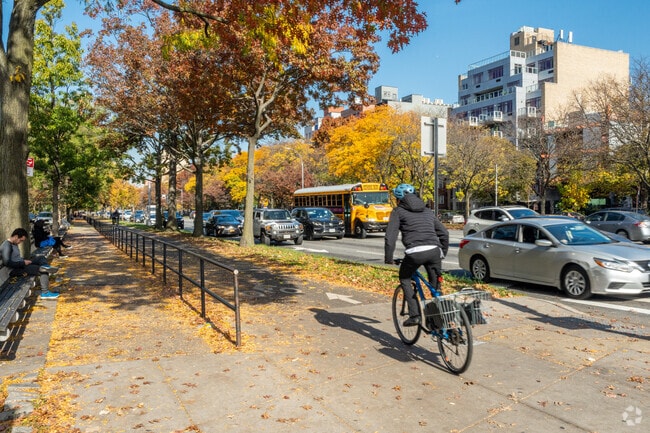
Kensington has bike lanes so bikers can safely get around city.
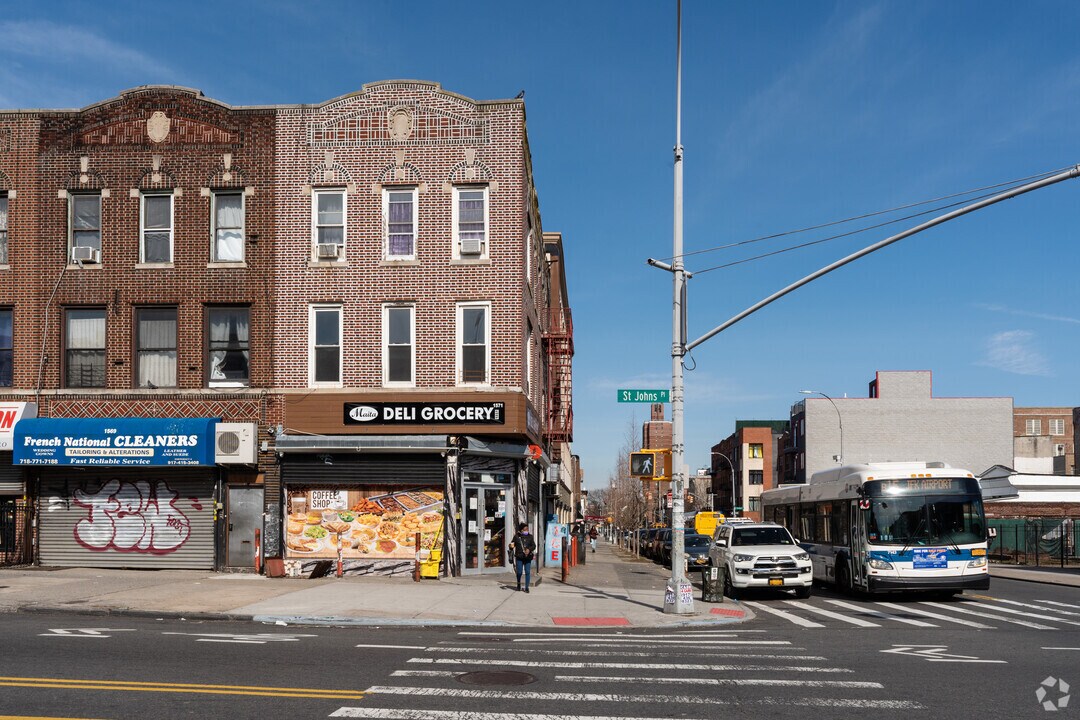
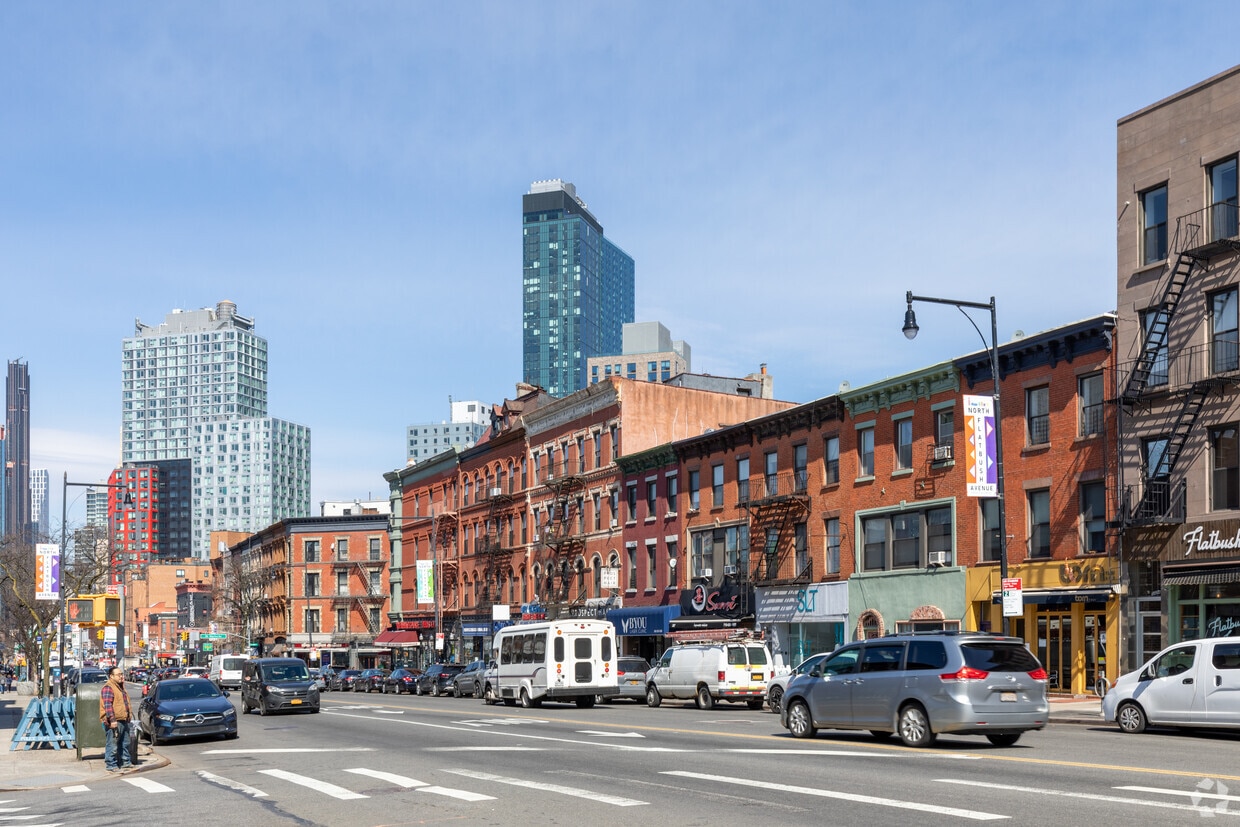
Flatbush Avenue is a major thoroughfare bordering Prospect Heights.
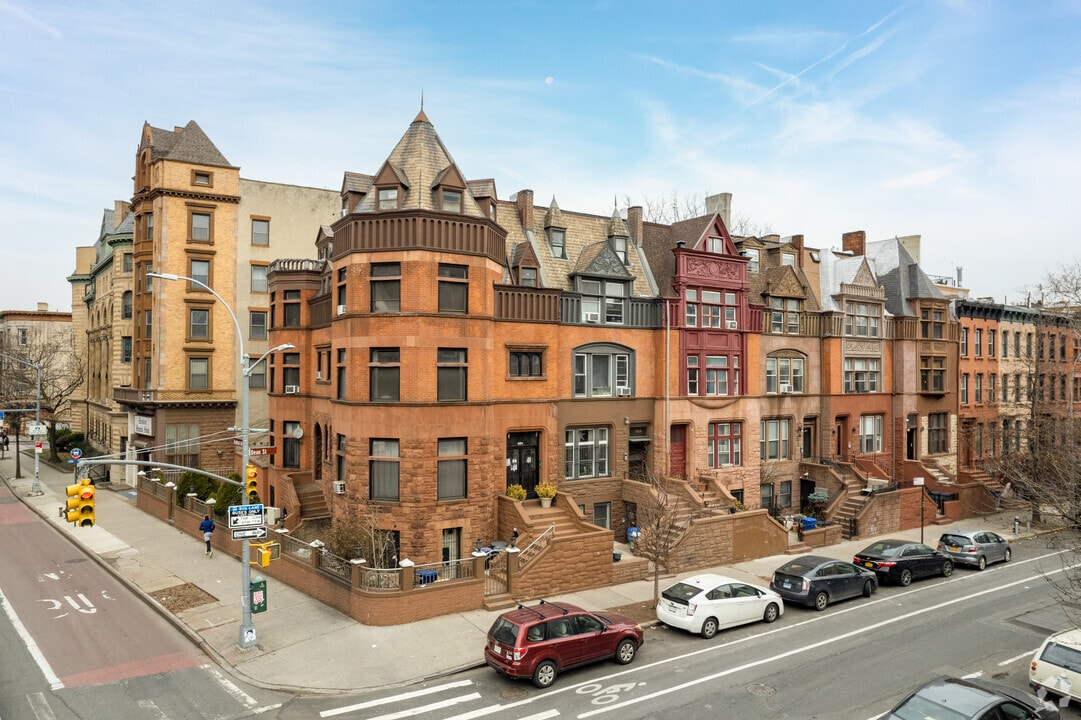
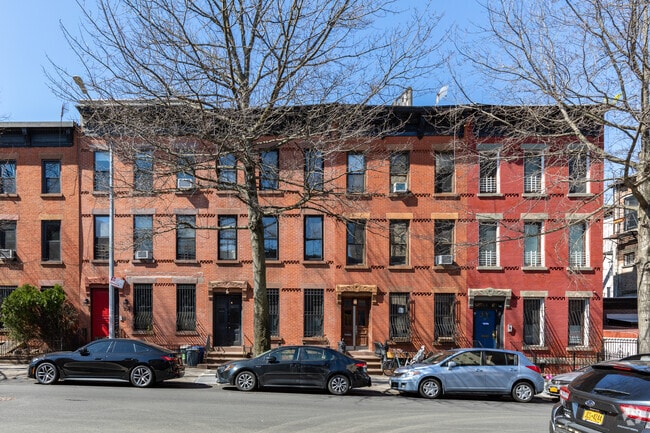
Beautiful brownstone buildings give Prospect Heights its charm.
Cozy restaurants on Vanderbilt Ave are a major draw to Prospect Heights.
Prospect Park is 526 acres and borders Prospect Heights.
Many new condominium buildings have recently popped up in Prospect Heights.
Median Household Income
$70,259
Average: $100,040
Education
815,061
Residents Have a Degree
Job Market
1,209,649
Workers Employed
Median Age
38 Years
Largest Age Group
30-39 Years
Approximately 16% of Residents
Under 20
24%
Over 65
17%
Housing Distribution
Brooklyn has more renters than homeowners.

Education Distribution
Review this city's overall education levels.

As of July 2026, the average apartment rent in Brooklyn, NY is $2,716 for a studio, $3,064 for one bedroom, $3,986 for two bedrooms, and $4,946 for three bedrooms. Apartment rent in Brooklyn has increased by 1.8% in the past year.
The cost of living in Brooklyn, NY is 64.7% higher than the national average. Generally, housing in Brooklyn is 184.7% more expensive than the national average, with rent falling between $2,716 - $4,946. You can expect to pay 14.2% more for groceries, 14.3% more for utilities, and 9.9% more for transportation.
Compare Cities

5 Most Affordable Neighborhoods in Brooklyn, NY
Experience all Brooklyn offers without breaking the bank. Explore our detailed guide to moving to Brooklyn on a budget.

Which NYC Borough Is Right for You?
Find your ideal NYC borough! Compare Manhattan's energy, Brooklyn's vibe, and more to decide the best spot for your next apartment.

5 Best Places to Live in Each New York City Borough
Exploring your options in the Big Apple? Discover the best parts of New York City with our detailed guide.
Is Brooklyn a Good Place to Live?
Thinking about moving to Brooklyn? Here are some pros and cons of living in Brooklyn to help you decide.
Best Neighborhoods in Brooklyn, NY for Renters
Don't know where to start your Brooklyn rental search? Here are five Brooklyn Neighborhoods perfect for renters.
Explore how walkable, bikeable, drivable, and transit-friendly Brooklyn, NY is for everyday living.
Exceptionally Walkable
Walkability
Exceptional Public Transit
Transit
Somewhat Drivable
Drivability
Fairly Bikeable
Bikeability
Public
Grades PK-5
656 Students

Public
Grades PK-5
499 Students
Public
Grades PK-5
498 Students
Success Academy Charter School-NYC 9
Public
Grades K-8
494 Students
Public
Grades K-5
270 Students
Success Academy Charter School-NYC 9
Public
Grades K-8
494 Students
Mark Twain is 239 for the Gifted and Talented
Public
Grades 6-8
1,297 Students

Public
Grades 6-8
1,030 Students
Public
Grades K-8
920 Students
Public
Grades K-8
891 Students
Brooklyn Technical High School
Public
Grades 9-12
5,850 Students
Public
Grades 9-12
772 Students
Millennium Brooklyn High School
Public
Grades 9-12
681 Students
Public
Grades 9-12
634 Students
Brooklyn Preparatory High School
Public
Grades 9-12
587 Students
† Our analysis of utilities, groceries, transportation, healthcare, home prices, and other goods and services is sourced from the Cost of Living Index, a respected benchmark published by the Council for Community and Economic Research (C2ER) that provides a thorough overview of living expenses across different regions.
Rent data is provided by CoStar Group’s Market Trend reports. As the industry leader in commercial real estate information, analytics, and news, CoStar conducts extensive research to produce and maintain a comprehensive database of commercial real estate information. We combine this data with public record to provide the most up-to-date rental information available.
Consumer goods, services, and home prices are sourced from the Cost of Living Index published by the Council for Community and Economic Research (C2ER). The data on this page is updated quarterly. It was last published in June 2026.
Demographic information comes from Neustar and combines detailed address data with U.S. Census and American Community Survey statistics to produce reliable local estimates.


