
Broadstone Savoie
35 112th Ave NE,
Bellevue, WA 98004
$2,093 - $5,442 Total Monthly Price
Studio - 2 Beds

Just across Lake Washington from Seattle lies Bellevue, a city nestled in breathtaking foliage. A botanical wonderland, this area of Washington is known for its lush gardens, such as Bellevue Botanical Garden, and its outdoor-centered parks and recreation. The easygoing mix of atmosphere and personality makes Bellevue a charming place to come home to and unwind.
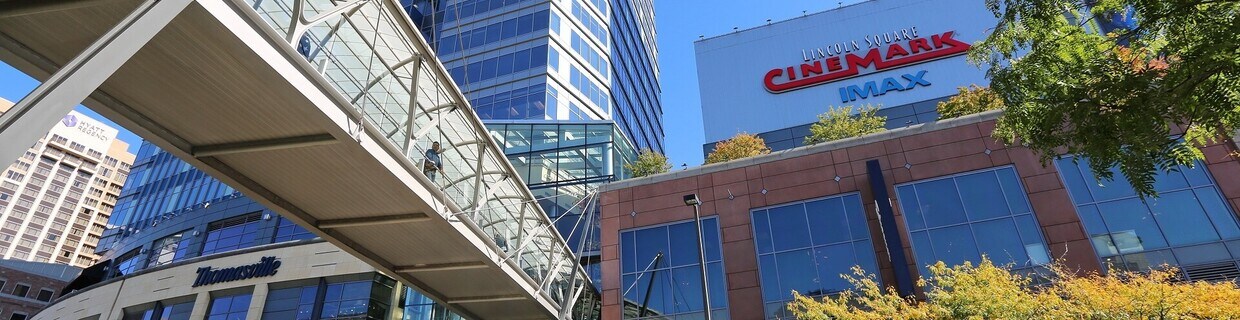
Its proximity to Seattle makes it a convenient satellite city while still featuring an exciting mix of unique museums and city-centric life, such as the Bellevue Arts Museum (BAM) and KidsQuest Children’s Museum, the Meydenbauer Center, and Bellevue Square.
Located between Lake Sammamish and Lake Washington, Bellevue features a trendy, bohemian day-and-night life with enchanting dining options and a quaint, artistic vibe. If you choose to rent an apartment in Bellevue, you’ll be right in the mix of a smartly charming atmosphere and stunning panoramic views of nature.
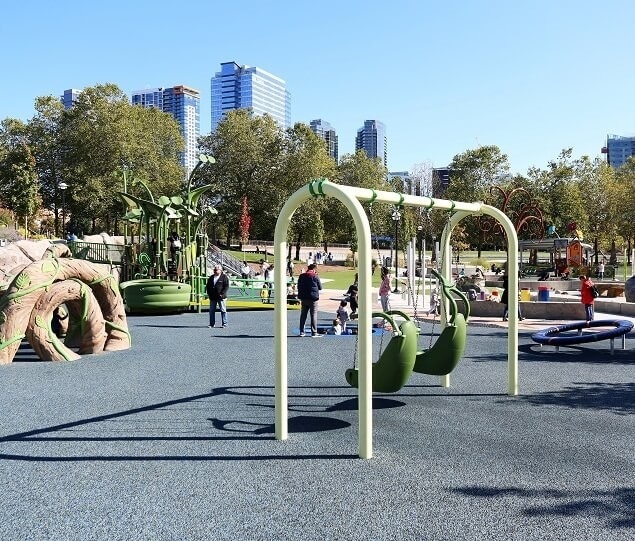
The Inspiration Playground is located in Bellevue Downtown Park
Bellevue Downtown Park features a 240-foot-wide waterfall and reflecting pond
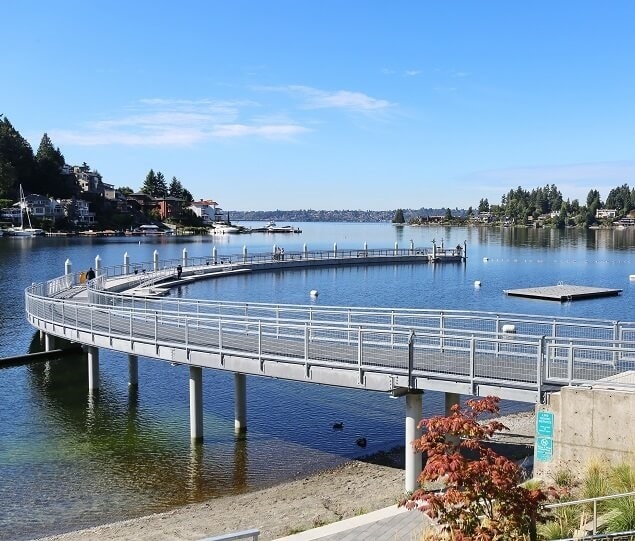
A 400-foot, curved pier extends into the bay at Meydenbauer Bay Park
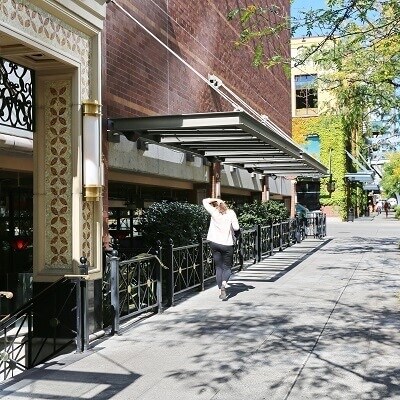
Old Bellevue, the original heart of Bellevue, is filled with shops and restaurants
Dating back to 1947, the Bellevue Arts Museum is across from Bellevue Square
Bellevue Park offers scenic views of downtown
As of March 2026, the average apartment rent in Bellevue, WA is $2,067 for a studio, $2,449 for one bedroom, $3,061 for two bedrooms, and $4,117 for three bedrooms. Apartment rent in Bellevue has decreased by -1.0% in the past year.
Explore how walkable, bikeable, drivable, and transit-friendly Bellevue, WA is for everyday living.
Somewhat Walkable
You might be able to get out and walk when living in this area. Some errands can be accomplished on foot, but for others you’ll need a car.
Some Transit
You'll likely want a car when living in this area since it has few transit options.
Bikeable
While there’s some bike infrastructure in this area, you’ll still need a car for many errands.
Public
Grades PK-5

Cherry Crest Elementary School
Public
Grades PK-5
Public
Grades K-5
Public
Grades PK-5
Public
Grades PK-5
Public
Grades 6-8
Public
Grades 6-8
Public
Grades 6-8

Public
Grades 6-8
Public
Grades 6-12

Public
Grades 9-12

Public
Grades 9-12
Public
Grades 9-12
Public
Grades 9-12
Public
Grades 6-12

3,490
Communities
959,386
Units
895
Cities

558
Communities
125,362
Units
221
Cities

197
Communities
71,233
Units
136
Cities

107
Communities
37,535
Units
58
Cities

171
Communities
59,412
Units
86
Cities

625
Communities
125,220
Units
245
Cities
† Our analysis of utilities, groceries, transportation, healthcare, home prices, and other goods and services is sourced from the Cost of Living Index, a respected benchmark published by the Council for Community and Economic Research (C2ER) that provides a thorough overview of living expenses across different regions.
Rent data is provided by CoStar Group’s Market Trend reports. As the industry leader in commercial real estate information, analytics, and news, CoStar conducts extensive research to produce and maintain a comprehensive database of commercial real estate information. We combine this data with public record to provide the most up-to-date rental information available.
Consumer goods, services, and home prices are sourced from the Cost of Living Index published by the Council for Community and Economic Research (C2ER). The data on this page is updated quarterly. It was last published in February 2026.


