

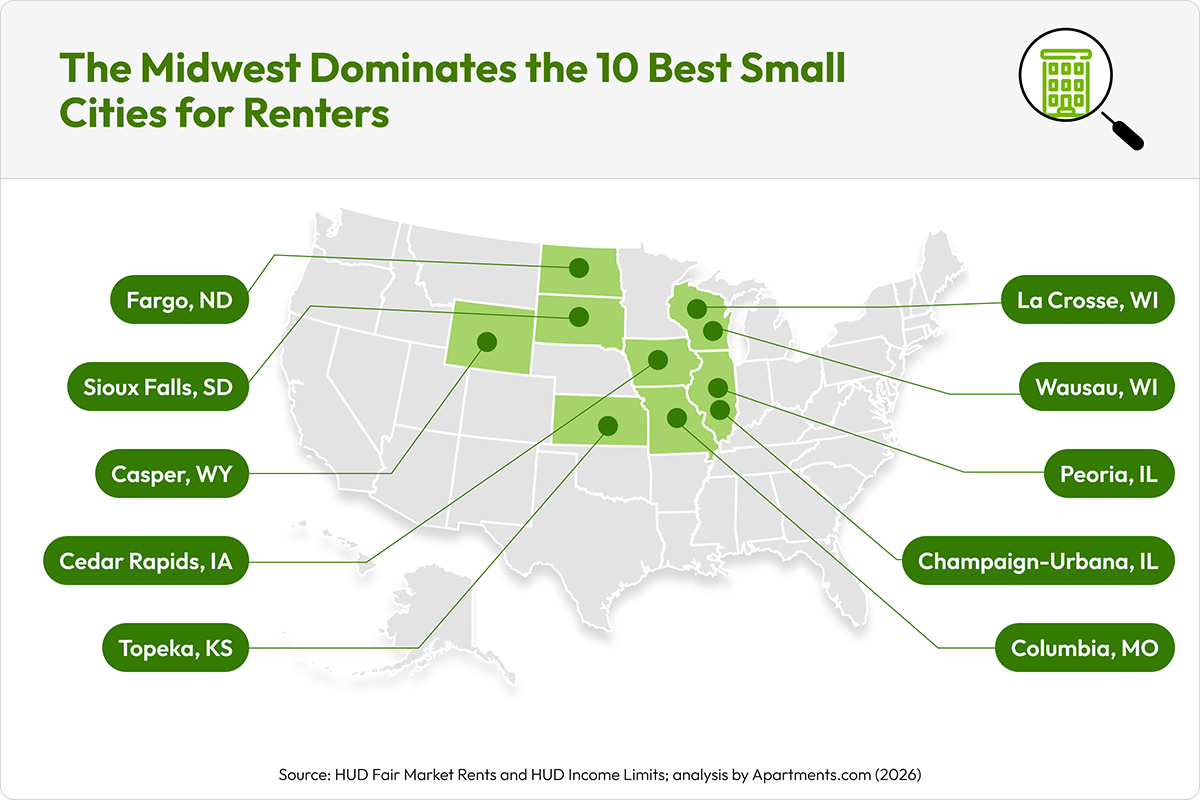
Small cities are gaining popularity as renters realize their budget can go further there. With lower rents than major metros, small cities boast a more favorable rent-to-income ratio for many renters. Yet, with thousands of these cities across the country, it can be tough to narrow them down. New Apartments.com data shows the 10 small U.S. cities where renters can get the most for their money in 2026.
Affordability is a commonality across small cities, as shown by two cities tying for first place: Peoria, IL, and Cedar Rapids, IA. Renters in both cities spend just 9.3 percent of their income on a one-bedroom apartment, 40 percent below the national average. However, with the volatility of the rental market, rents are constantly fluctuating and they are rising in many of these small cities. Acting quickly on this data allows renters to take advantage of the current affordability found in these cities.
To create this analysis, we looked at Apartments.com renter data, as well as U.S. Housing and Urban Development (HUD) and U.S. Census Bureau and Census figures. We ranked 180 small and mid-size metro areas outside the 30 largest U.S. metros by rent-to-income ratio. The income figure used is the area’s median household income, not renter households specifically, so renters may find that the actual math differs a bit for them.
Key Takeaways
- Renters across all 10 ranked cities pay just 9.9 percent of their income for a one-bedroom on average, about 37 percent less than the national figure of 15.6 percent.
- One-bedroom rent rose more than eight percent in a single year in five of the top 10 cities, led by a 17.3 percent jump in Columbia, MO. That is two times the national pace of about four percent.
- Every city on the list beats the national rent benchmark across all three unit sizes, from studios to two-bedrooms, not just one-bedrooms.
The Top 10 Under-the-Radar Cities
Zeroing in on the individual cities in this ranking shows just how much value renters are getting compared to the national rent-to-income average of 15.6 percent. The table below ranks the top 10 small cities by rent-to-income ratio, calculated by dividing the one-bedroom average rent of the city by the monthly median household income.
Notably, the majority of the top 10 are Midwest metros. Many of them are also college towns, like Champaign (home to the University of Illinois) and Columbia (home to the University of Missouri), which bring unique energy to the cities with tons of restaurants, events, and year-round activities.
|
Rank |
City |
Studio Rent |
1-Bedroom Rent |
2-Bedroom Rent |
Median Household Income |
Rent-to-Income Ratio (1-Bedroom) |
|
1 (Tie) |
$758/month |
$818/month |
$1,039/month |
$106,100 |
9.3% |
|
|
1 (Tie) |
$738/month |
$816/month |
$1,071/month |
$105,300 |
9.3% |
|
|
3 |
$768/month |
$917/month |
$1,112/month |
$115,200 |
9.6% |
|
|
4 |
$941/month |
$946/month |
$1,122/month |
$114,300 |
9.9% |
|
|
5 (Tie) |
$792/month |
$820/month |
$1,057/month |
$98,800 |
10.0% |
|
|
5 (Tie) |
$865/month |
$986/month |
$1,156/month |
$118,700 |
10.0% |
|
|
7 |
$804/month |
$889/month |
$1,166/month |
$105,800 |
10.1% |
|
|
8 |
$800/month |
$1,011/month |
$1,160/month |
$119,200 |
10.2% |
|
|
9 (Tie) |
$767/month |
$852/month |
$1,082/month |
$99,500 |
10.3% |
|
|
9 (Tie) |
$791/month |
$889/month |
$1,147/month |
$103,600 |
10.3% |
- Peoria, IL (Tie)

- Rent-to-income ratio (1BR) in Peoria: 9.3 percent
- Average rent in Peoria: $818/month
- Median household income in Peoria: $106,100
- Cost of living in Peoria: -5.2 percent
Peoria ties with Cedar Rapids for the most favorable rent-to-income at 9.3 percent. The most meaningful value comes from housing being 30.1 percent lower than the U.S. average, though groceries and goods and services also come in lower than national rates.
As the principal city of the Peoria metropolitan area, Peoria has a strong base across education, culture, employers, and entertainment. Caterpillar Tractor Company and OSF Saint Francis Medical Center are the largest employers in the city, alongside multiple colleges and several medical institutions. The Illinois River corridor, extensive park system, and retail and dining districts all keep the city active at a low price.
|
Fairly Walkable |
Limited Public Transit |
Somewhat Bikeable |
50Peoria has a walkability score of 50 out of 100. |
30Peoria has a transit score of 30 out of 100. |
30Peoria has a bikeability score of 30 out of 100. |
- Cedar Rapids, IA (Tie)

- Rent-to-income ratio (1BR) in Cedar Rapids: 9.3 percent
- Average rent in Cedar Rapids: $816/month
- Median household income in Cedar Rapids: $105,300
- Cost of living in Cedar Rapids: -10 percent
Cedar Rapids may have tied with Peoria for our number one spot, but its lower cost of living and having the lowest average rent out of all the cities gives it an edge. At 10 percent below the national average, it boasts expenses that are below average across the board, except for healthcare and utilities. Yet, that doesn’t mean that Cedar Rapids will always be affordable, as rents increased 7.7 percent over the past year, the highest growth out of all the cities.
As the economic hub of eastern Iowa and the second-most populous city in Iowa, Cedar Rapids has a diverse set of employers. The top industries range from education and government to aerospace and food processing.
|
Fairly Walkable |
Limited Public Transit |
Very Bikeable |
40Cedar Rapids has a walkability score of 40 out of 100. |
30Cedar Rapids has a transit score of 30 out of 100. |
80Cedar Rapids has a bikeability score of 80 out of 100. |
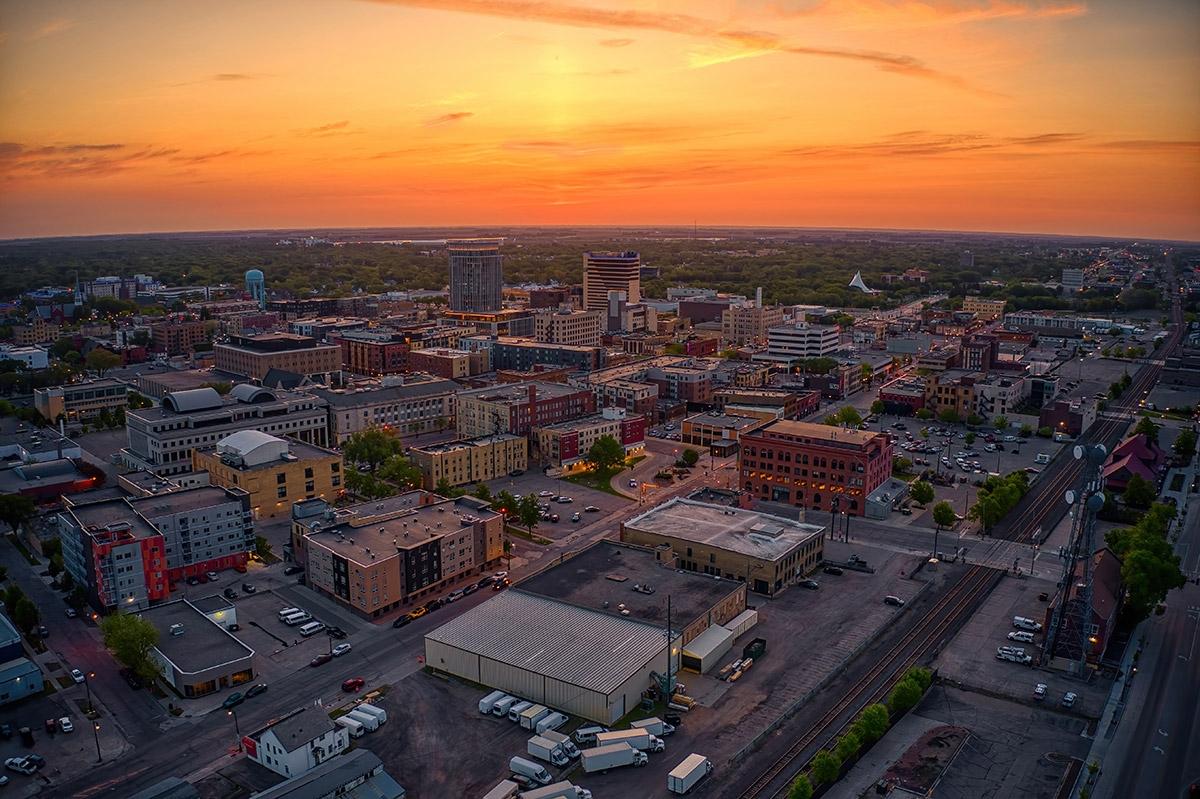
- Rent-to-income ratio (1BR) in Fargo: 9.6 percent
- Average rent in Fargo: $917/month
- Median household income in Fargo: $115,200
- Cost of living in Fargo: -3.9 percent
Fargo is the most populous city in North Dakota, and though it has a favorable rent-to-income ratio, expenses can still reflect the city’s status as a regional center. Fargo’s overall housing costs 4.4 percent more than the U.S. average for renters specifically, though overall housing costs are 16.8 percent lower. However, the average rent of $964/month is 42 percent lower than the national average of $1,665/month.
The city’s economy has diversified in recent decades, as shown by its local employers, which cover a wide breadth of industries, including government, food processing, manufacturing, healthcare, and education. Fargo also has an arts and cultural scene befitting the biggest city in the state with festivals, museums, and performance venues.
|
Fairly Walkable |
Limited Public Transit |
Fairly Bikeable |
50Fargo has a walkability score of 50 out of 100. |
20Fargo has a transit score of 20 out of 100. |
50Fargo has a bikeability score of 50 out of 100. |

- Rent-to-income ratio (1BR) in Champaign: 9.9 percent
- Average rent in Champaign: $946/month
- Median household income in Champaign: $114,300
- Cost of living in Champaign: -2.4 percent
While most cities have universities, Champaign stands out for being home to the University of Illinois, one of the largest public universities by enrollment in the country. This largely drives the city’s culture and economy, though it also holds several Fortune 500 companies and headquarters.
Consequently, the cost of living is not as low as it is in many of the other cities in this ranking, at only 2.4 percent lower than the national average. Yet, the savings that matter the most to renters are noticeable. Housing costs are 16.3 percent below the national average, and rent prices are 33 percent lower.
|
Fairly Walkable |
Some Public Transit |
Fairly Bikeable |
50Champaign has a walkability score of 50 out of 100. |
50Champaign has a transit score of 50 out of 100. |
50Champaign has a bikeability score of 50 out of 100. |
- Topeka, KS (Tie)
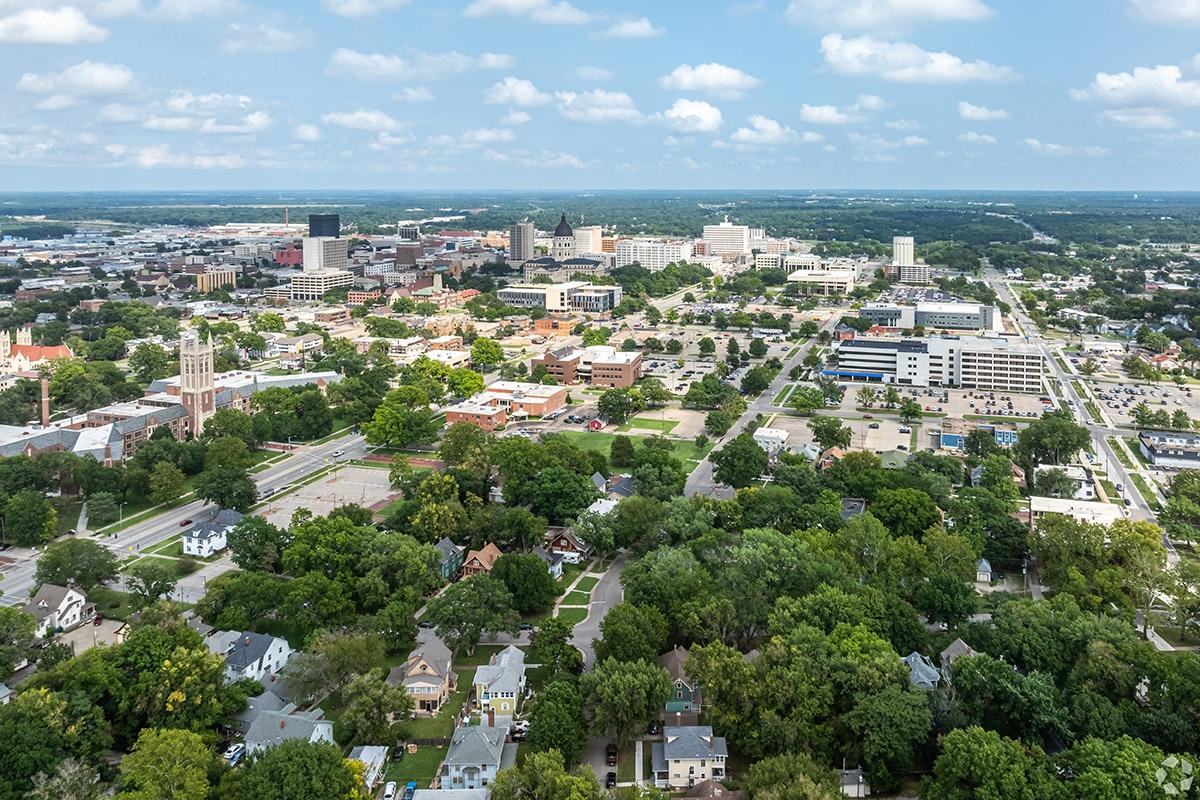
- Rent-to-income ratio (1BR) in Topeka: 10 percent
- Average rent in Topeka: $820/month
- Median household income in Topeka: $98,800
- Cost of living in Topeka: -13.6 percent
Topeka, Kansas’ capital, is a city that revolves around the state government. The State of Kansas is by far the city’s biggest employer, followed by education, healthcare, and social services. Even though it is the capital, Topeka offers a cost of living 13.6 percent lower than the national average, the lowest on this list. A major component of those savings comes from rents being almost 50 percent lower than the national average.
|
Fairly Walkable |
Limited Public Transit |
Moderately Bikeable |
50Topeka has a walkability score of 50 out of 100. |
30Topeka has a transit score of 30 out of 100. |
60Topeka has a bikeability score of 60 out of 100. |
- Sioux Falls, SD (Tie)

- Rent-to-income ratio (1BR) in Sioux Falls: 10 percent
- Average rent in Sioux Falls: $986/month
- Median household income in Sioux Falls: $118,700
- Cost of living in Sioux Falls: -12.5 percent
Like Fargo, Sioux Falls is the most populous city in its state, but despite this, it offers more value. The cost of living is well below the national average at -12.5 percent, and expenses are lower across all categories (except for healthcare). Renters should expect to pay around $3,874/month to cover expenses.
Many financial companies have relocated to the city, possibly drawn by the lack of a state corporate income tax. Manufacturing and food processing remain significant contributors to the economy, and have been for a long time, but healthcare has grown into an equally important sector.
|
Fairly Walkable |
Limited Public Transit |
Exceptionally Bikeable |
50Sioux Falls has a walkability score of 50 out of 100. |
30Sioux Falls has a transit score of 30 out of 100. |
90Sioux Falls has a bikeability score of 90 out of 100. |

- Rent-to-income ratio (1BR) in La Crosse: 10.1 percent
- Average rent in La Crosse: $889/month
- Median household income in La Crosse: $105,800
La Crosse is one of the many cities on this list with average rent less than $900. It differentiates itself through its location on the Mississippi River and the Wisconsin – Minnesota border. This has made it an attractive place for companies to house headquarters, regional offices, and health systems, including Kwik Trip, Gundersen Health System, and Mayo Clinic Health System – La Crosse.
|
Somewhat Walkable |
Exceptionally Drivable |
Moderately Bikeable |
30La Crosse has a walkability score of 30 out of 100. |
100La Crosse has a drivability score of 100 out of 100. |
60La Crosse has a bikeability score of 60 out of 100. |

- Rent-to-income ratio (1BR) in Columbia: 10.2 percent
- Average rent in Columbia: $1,011/month
- Median household income in Columbia: $119,200
- Cost of living in Columbia: -9.6 percent
Columbia is one of the few cities on our list where all expense categories (groceries, housing, utilities, transportation, healthcare, and goods and services) are all lower than national averages. Housing delivers the biggest savings at 23.3 percent below the national average, and even the smallest discount, groceries, still comes in 3.2 percent below.
It has become a hotspot for education, home to the University of Missouri, Stephens College, and Columbia College. This has also given rise to a major healthcare system, making education and healthcare the anchors of Columbia’s economy, with insurance, finance, and tech filling in the gaps.
|
Very Walkable |
Moderately Drivable |
Very Bikeable |
80Columbia has a walkability score of 80 out of 100. |
60Columbia has a drivability score of 60 out of 100. |
80Columbia has a bikeability score of 80 out of 100. |
- Casper, WY (Tie)

- Rent-to-income ratio (1BR) in Casper: 10.3 percent
- Average rent in Casper: $852/month
- Median household income in Casper: $99,500
- Cost of living in Casper: -10.1 percent
Casper may be tied with Wausau on rent-to-income ratio, but it has the advantage in cost of living. Casper runs 10.1 percent below the national average, compared to 6.2 percent for Wausau, a 3.9 percentage point difference. Even though the city stands out for its affordability, its rents are rising. The average rent rose five percent over the past year, second to only Cedar Rapids on this list.
|
Somewhat Walkable |
Very Drivable |
Fairly Bikeable |
30Casper has a walkability score of 30 out of 100. |
80Casper has a drivability score of 80 out of 100. |
40Casper has a bikeability score of 40 out of 100. |
- Wausau, WI (Tie)

- Rent-to-income ratio (1BR) in Wausau: 10.3 percent
- Average rent in Wausau: $889/month
- Median household income in Wausau: $103,600
- Cost of living in Wausau: -6.2 percent
Wausau embodies its motto, “Welcome home to Wausau.” It retains that small-town, close-knit vibe that some of the other cities have grown out of. With a city population of around 40,000 and the overall Wausau metropolitan statistical area reaching a little less than 140,000, it keeps a relaxed atmosphere with brick-lined streets, historic buildings, and city-wide events.
Another part of its small-city draw is that the cost of living is 6.2 percent lower than the national average. These same savings extend to rent prices. With an average rent of $889/month, renters pay about $555 less each month than they would at the national average.
|
Fairly Walkable |
Limited Public Transit |
Fairly Bikeable |
50Wausau has a walkability score of 50 out of 100. |
30Wausau has a transit score of 30 out of 100. |
40Wausau has a bikeability score of 40 out of 100. |
Rents Are Climbing, But These Cities Still Offer Affordable Options
Rents have climbed all over the country, and affordability has become a major point of concern for many renters. In a recent survey, Apartments.com found that 47 percent of renters have changed their living situation or rental search criteria just to keep up with bills and other living expenses. Another survey found that four out of five renters cited price among their top three considerations when selecting their next residence.
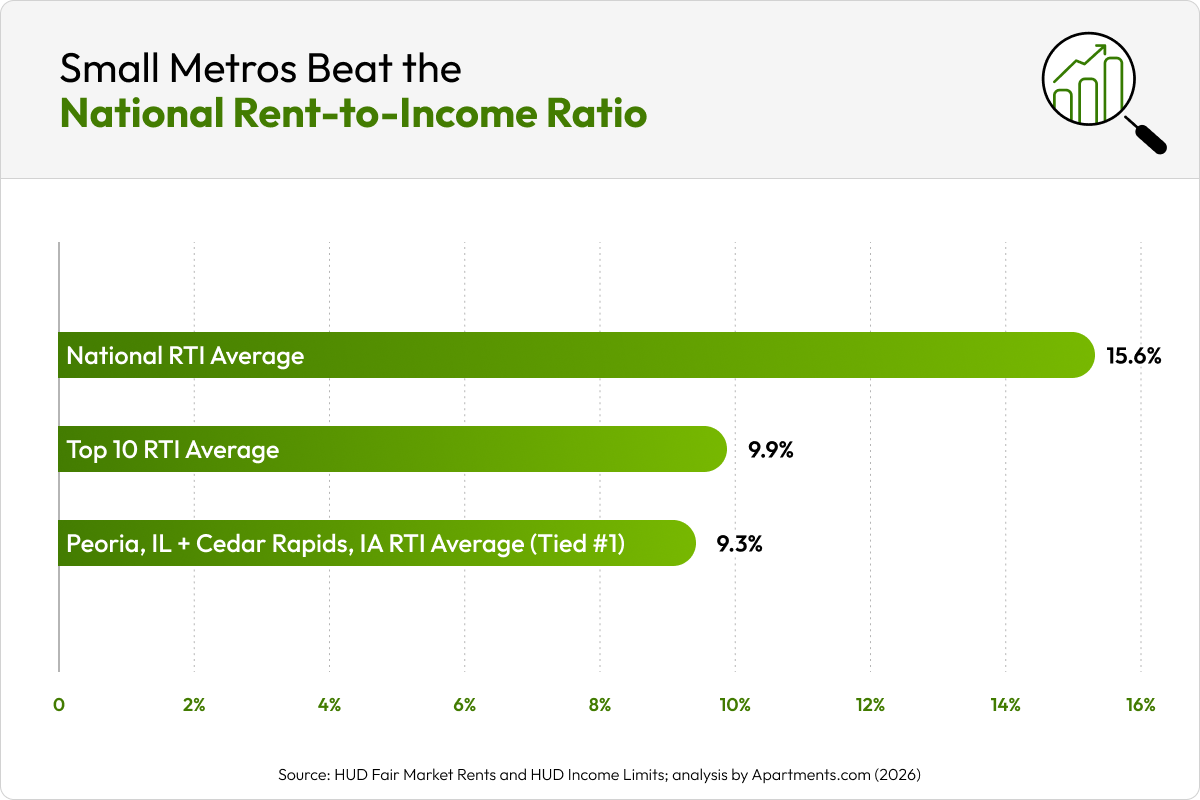
Nationally, renters spend 15.6 percent of their income on a one-bedroom apartment, but many face steeper prices in major metros, like San Francisco or New York. San Francisco's rent-to-income ratio more than doubles the national average at 33.8 percent, while New York's climbs to 70.8 percent, over four and a half times the national figure. The cities on this list offer affordability that doesn’t just beat out big cities but the national average, too. Across the 10 ranked cities, that average is 9.9 percent, about 37 percent lower than the national rate.
Affordability isn't just for specific floor plans, either. Every one of the 10 cities beats the national rent across all unit sizes (studios, one-bedrooms, and two-bedrooms). The national average rent sits at $1,338 for studios, $1,444 for one-bedrooms, and $1,725 for two-bedrooms.
But the value won’t last forever
While these cities currently offer unbeatable value, that could change with time. Rent growth in half of the top 10 cities is almost double the national pace of four percent. One-bedroom rent rose more than 8 percent in a single year in 5 of the 10 cities (Fargo, Topeka, Sioux Falls, Columbia, and Wausau). Columbia, MO, saw the biggest jump at 17.3 percent.
It Pays to Think Small
These 10 cities are easy to overlook, but the numbers make a clear case for renters to consider them. Each one lets renters keep more of their paycheck, with a lower cost of living across the board and rent-to-income ratios well below what most of the country pays.
Since rent and listing data are constantly shifting, it's worth checking current numbers before making a move; today's affordability isn't guaranteed to last, especially in the fastest-rising markets on this list. If you’re ready to see what your budget can get you, start searching on Apartments.com.
Methodology
For this report, we ranked 180 eligible cities, drawn from markets outside the Census Bureau’s 30 largest metro areas.
For each city, we compared two official government figures published by HUD: the typical rent for a one-bedroom apartment (HUD Fair Market Rents) and the typical family income for that area (HUD Income Limits). These are the 40th-percentile gross rents HUD sets for its voucher programs, not an average of Apartments.com listings.
Dividing rent by income yields a percentage, which we ranked from smallest to largest to identify the top 10 cities. The term "income" throughout this analysis refers to each area's HUD median family income, not individual renters' income. Renters as a group typically earn less than the broader family-household median, so their actual share of income going to rent likely runs higher than these ratios suggest.
The 15.6 percent national average uses this same formula, calculated for every U.S. county and then averaged, weighted by 2023 Census population. Nationally, the same population-weighted method puts the average Fair Market Rent at $1,338 for studios, $1,444 for one-bedrooms, and $1,725 for two-bedrooms.
Apartments.com’s proprietary renter data and Cost of Living pages add context to the rankings, but the rankings themselves rely only on the government rent and income figures above.
FAQs
Is it better to live in a small city?
Living in a small city can be a smart choice for renters who want lower rent, less noise, and a slower pace of life. Smaller cities often offer a lower cost of living, more space for the price, easier access to nature, and a stronger sense of community.
However, there are trade-offs. Public transportation is often limited, job opportunities can be fewer, and dining or entertainment options may feel more limited than in larger cities. Whether a small city is the better option depends on your lifestyle, career needs, and what you value most in where you live. Those trade-offs aren’t universal, as small cities near major metropolitan areas offer some of the same benefits as the big cities due to their proximity.
Where can renters get more space for their budget?
Renters get the most space for their budget in cities that aren’t major metros. For example, $2,000 in rent may only cover a small studio or one-bedroom in places like New York or San Francisco, but that same budget stretches much further elsewhere. In Baltimore or Pittsburgh, it can get you all the way up to a three-bedroom apartment.


