Median Age
36 Years
Largest Age Group
20-29 Years
Approximately 20% of Residents
Under 20
22%
Over 65
20%


Area Guide
Avg Rent
$960
Population
47,156
Renter Mix
61% Rent
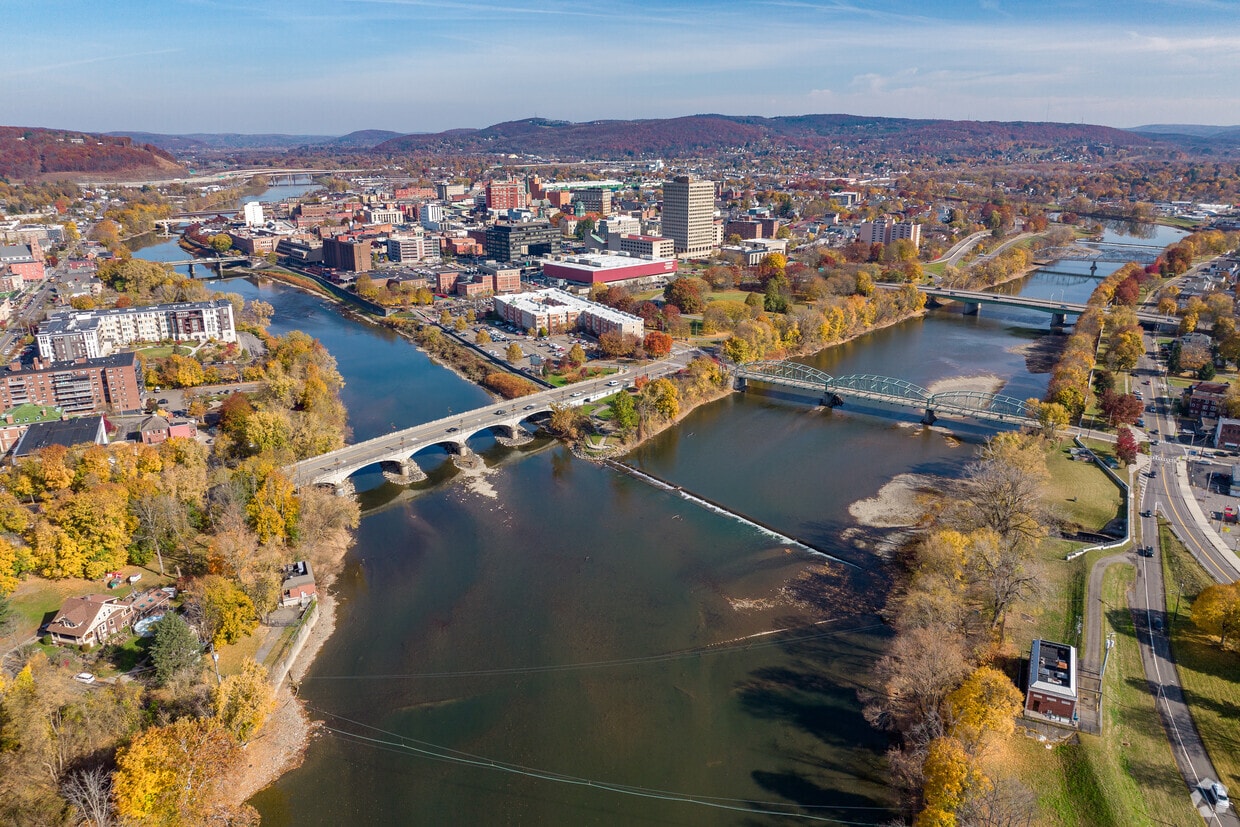
Located at the meeting point of the Susquehanna and Chenango Rivers, Binghamton combines small-city charm with cultural attractions in New York's Southern Tier. Known as the Carousel Capital of the World, the city preserves its historic character while welcoming new development through Binghamton University's downtown campus. Housing options include Victorian-era homes in the West Side district and apartments throughout downtown. The First Ward features antique shops along Clinton Street, while the Southside neighborhood connects to downtown via the South Washington Street Bridge.
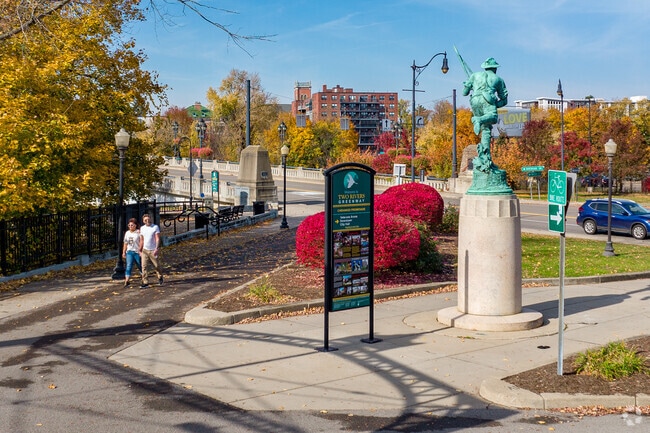
The local arts community shines during First Friday Art Walks, with galleries throughout downtown showcasing area artists. Outdoor enthusiasts can explore the Binghamton River Trail's 1.5-mile path along the Chenango River. The annual Spiedie Fest and Balloon Rally at Otsiningo Park has become a regional tradition, drawing crowds each August. Recreation Park houses one of the city's historic carousels that inspired Binghamton's nickname. Downtown's mix of preserved architecture and newer developments centers around the Binghamton University Downtown Center, adding to the area's appeal.
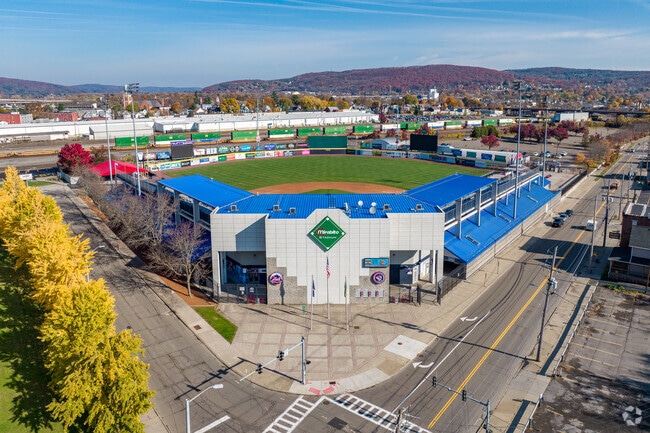
Mirabito Stadium hosts Binghamton Rumble Ponies games in Binghamton.
Binghamton is complemented by a park overlooking the two waterways that surround downtown.
Confluence Park is one of Binghamton’s flagship green spaces due to its location.
Binghamton residents head to the Ross Park Zoo to view a roster of animals.
Single-family homes are the most common housing style in Binghamton.
Median Household Income
$41,429
Average: $65,138
Education
11,945
Residents Have a Degree
Job Market
20,103
Workers Employed
Median Age
36 Years
Largest Age Group
20-29 Years
Approximately 20% of Residents
Under 20
22%
Over 65
20%
Housing Distribution
Binghamton has more renters than homeowners.

Education Distribution
Review this city's overall education levels.

As of June 2026, the average apartment rent in Binghamton, NY is $678 for a studio, $960 for one bedroom, $1,166 for two bedrooms, and $1,098 for three bedrooms. Apartment rent in Binghamton has increased by 3.6% in the past year.
Explore how walkable, bikeable, drivable, and transit-friendly Binghamton, NY is for everyday living.
Moderately Walkable
Walkability
Limited Public Transit
Transit
Exceptionally Drivable
Drivability
Fairly Bikeable
Bikeability
Public
Grades PK-5
355 Students

Chenango Forks Elementary School
Public
Grades PK-5
605 Students

Public
Grades PK-5
399 Students
Public
Grades PK-5
281 Students
Public
Grades PK-5
205 Students
Public
Grades 6-8
275 Students
Public
Grades PK & 6-8
539 Students
Public
Grades 6-8
379 Students
Public
Grades 6-8
465 Students

Public
Grades K-12
1,028 Students

Public
Grades 9-12
508 Students

Public
Grades 9-12
367 Students

Public
Grades PK & 9-12
1,257 Students

Public
Grades K-12
1,028 Students
Greater Binghamton Health Center
Public
Grades 9-12
3 Students
† Our analysis of utilities, groceries, transportation, healthcare, home prices, and other goods and services is sourced from the Cost of Living Index, a respected benchmark published by the Council for Community and Economic Research (C2ER) that provides a thorough overview of living expenses across different regions.
Rent data is provided by CoStar Group’s Market Trend reports. As the industry leader in commercial real estate information, analytics, and news, CoStar conducts extensive research to produce and maintain a comprehensive database of commercial real estate information. We combine this data with public record to provide the most up-to-date rental information available.
Consumer goods, services, and home prices are sourced from the Cost of Living Index published by the Council for Community and Economic Research (C2ER). The data on this page is updated quarterly. It was last published in June 2026.
Demographic information comes from Neustar and combines detailed address data with U.S. Census and American Community Survey statistics to produce reliable local estimates.


