Median Age
38 Years
Largest Age Group
25-34 Years
Approximately 14% of Residents
Under 20
26%
Over 65
17%


Avg Rent
$802
Population
97,777
Renter Mix
46% Rent
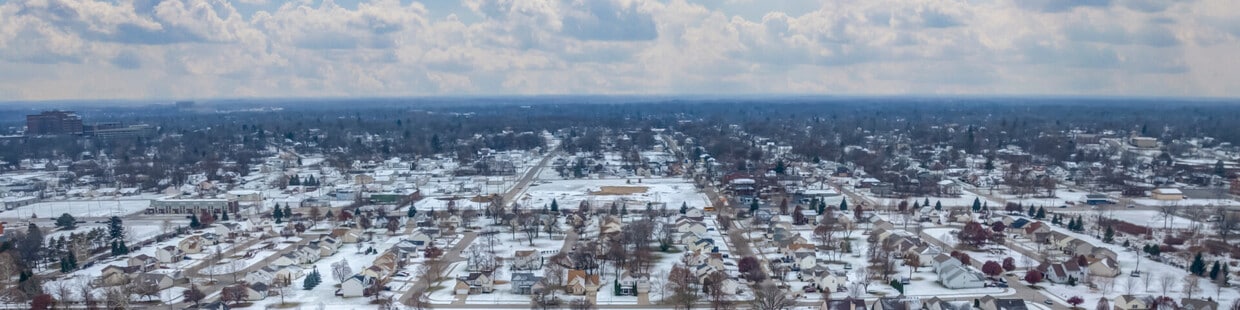
Living in Flint combines affordability with access to arts, education, and recreation. The city's rental market remains steady, with one-bedroom apartments averaging $753 per month, representing a 2.7% annual increase. Housing options span across several neighborhoods, including the College/Cultural District and the University Avenue area, home to the University of Michigan-Flint and Kettering University campuses. The Flint Cultural Center anchors the arts community with the Flint Institute of Arts and Sloan Museum.
The city features an extensive parks system, including Stepping Stone Falls and For-Mar Nature Preserve, while the Flint River Trail offers opportunities for walking and cycling. The historic Carriage Town district preserves the city's architectural heritage with its Victorian-era homes. Annual events like Back to the Bricks car show and cruise celebrate the community's automotive history. Flint continues to evolve through development initiatives, including downtown revitalization projects and educational expansion, while maintaining affordable housing options compared to other Michigan cities.
The iconic Stepping Stone Falls in Flint is a tremendous local relaxing destination.
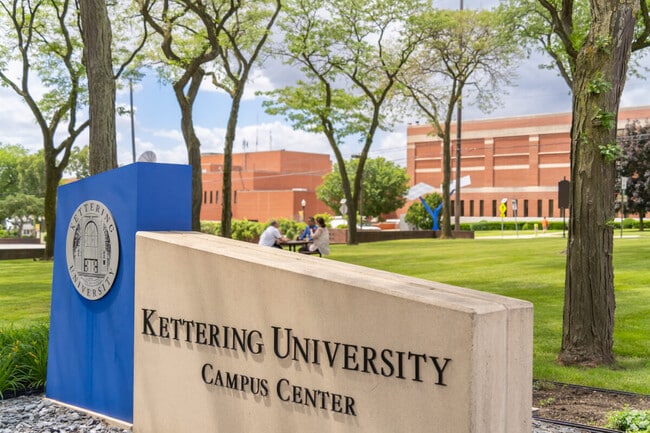
Kettering University is one of three universities in Flint.
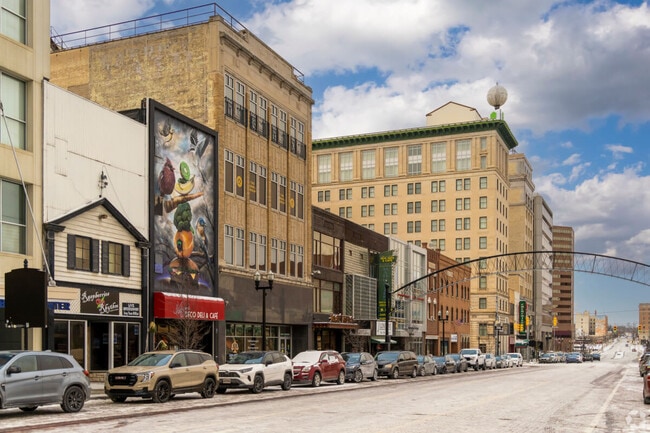
Flint is creating a walkable entertainment hub downtown.
Median Household Income
$32,967
Average: $43,749
Education
12,115
Residents Have a Degree
Job Market
36,666
Workers Employed
Median Age
38 Years
Largest Age Group
25-34 Years
Approximately 14% of Residents
Under 20
26%
Over 65
17%
Housing Distribution
Flint has more homeowners than renters.

Education Distribution
Review this city's overall education levels.

As of July 2026, the average apartment rent in Flint, MI is $668 for a studio, $802 for one bedroom, $941 for two bedrooms, and $993 for three bedrooms. Apartment rent in Flint has increased by 2.5% in the past year.
The cost of living in Flint, MI is 10.3% lower than the national average. Generally, housing in Flint is 26.5% less expensive than the national average, with rent falling between $668 - $993. You can expect to pay 0.7% less for groceries, 0% less for utilities, and 0.1% more for transportation.
Compare Cities
Explore how walkable, bikeable, drivable, and transit-friendly Flint, MI is for everyday living.
Fairly Walkable
Walkability
Some Public Transit
Transit
Exceptionally Drivable
Drivability
Moderately Bikeable
Bikeability
Public
Grades K-8
794 Students

Public
Grades PK-5
182 Students
Kate Dowdall Elementary School
Public
Grades K-5
406 Students

Madison Academy Elementary/Middle School
Public
Grades K-8
400 Students
Leota Fiedler Elementary School
Public
Grades K-5
392 Students
Public
Grades K-8
794 Students
Public
Grades 6-12
1,033 Students
Madison Academy Elementary/Middle School
Public
Grades K-8
400 Students
Public
Grades PK-8
274 Students
International Academy of Flint (K-12)
Public
Grades K-12
919 Students

Public
Grades 9-12
826 Students

Public
Grades 9-12
184 Students
Mott Middle College High School
Public
Grades 9-12
293 Students
Public
Grades 6-12
1,033 Students
International Academy of Flint (K-12)
Public
Grades K-12
919 Students
† Our analysis of utilities, groceries, transportation, healthcare, home prices, and other goods and services is sourced from the Cost of Living Index, a respected benchmark published by the Council for Community and Economic Research (C2ER) that provides a thorough overview of living expenses across different regions.
Rent data is provided by CoStar Group’s Market Trend reports. As the industry leader in commercial real estate information, analytics, and news, CoStar conducts extensive research to produce and maintain a comprehensive database of commercial real estate information. We combine this data with public record to provide the most up-to-date rental information available.
Consumer goods, services, and home prices are sourced from the Cost of Living Index published by the Council for Community and Economic Research (C2ER). The data on this page is updated quarterly. It was last published in June 2026.
Demographic information comes from Neustar and combines detailed address data with U.S. Census and American Community Survey statistics to produce reliable local estimates.


