Median Age
41 Years
Largest Age Group
30-39 Years
Approximately 15% of Residents
Under 20
22%
Over 65
20%


Area Guide
Avg Rent
$1,791
Population
39,441
Renter Mix
41% Rent
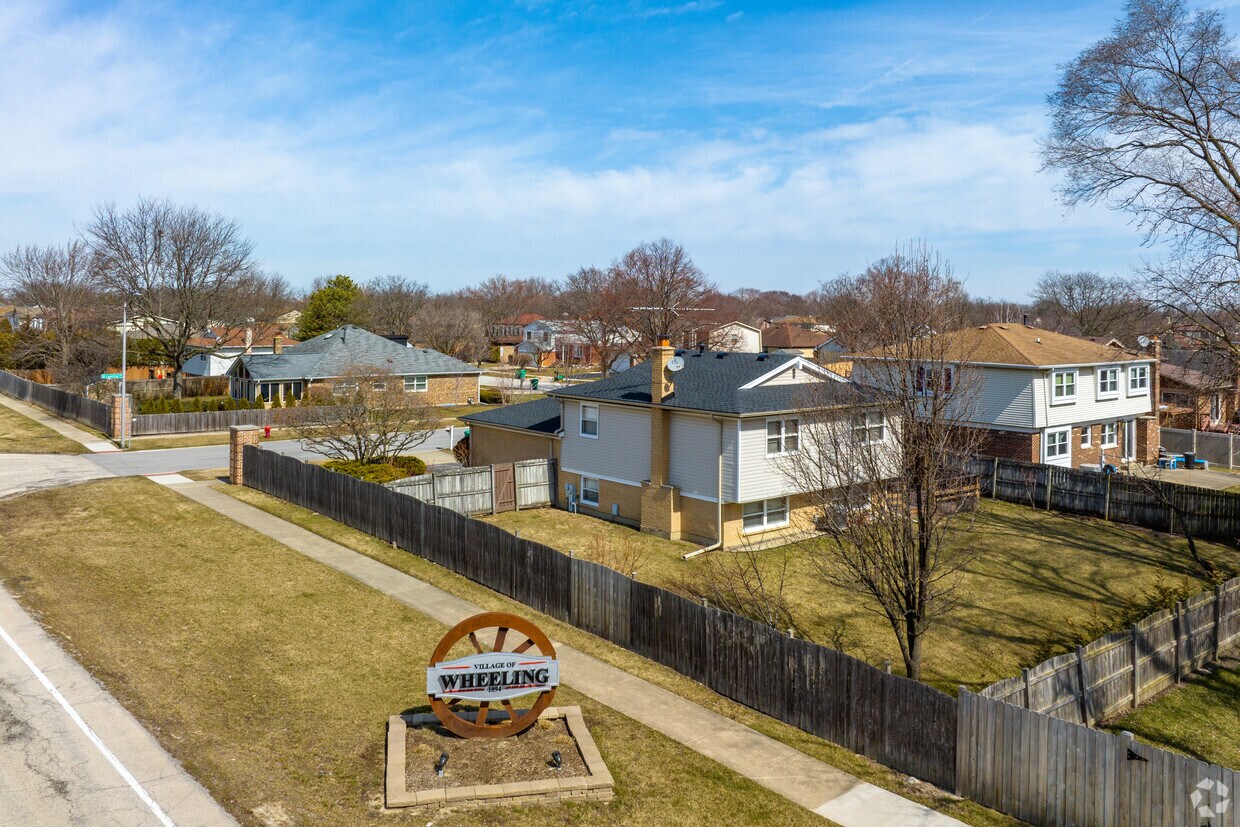
Wheeling is a small suburban city positioned about thirty miles northwest of the Chicago Loop and about fifteen miles north of O’Hare Airport. Small shopping centers and office parks are scattered amongst the quiet residential neighborhoods, allowing many folks to easily get around on foot or by bike. The sprawling Potawatomi Woods border the entire east side of town, providing a lush natural enclave perfect for exploring on the weekends.
Rentals in Wheeling range from moderately-priced apartments to more upscale single-family homes, with options available to fit any lifestyle. Metrarail service will get you to Union Station in under an hour, making it easy to hop into Chicago for work or leisure anytime.
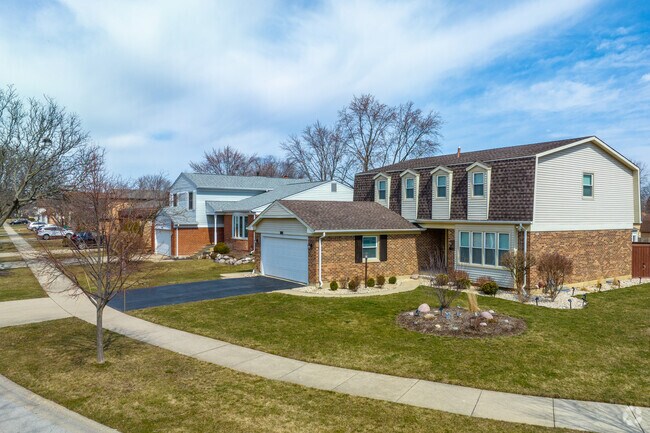
Row Of Houses With Large Front Yards In Wheeling
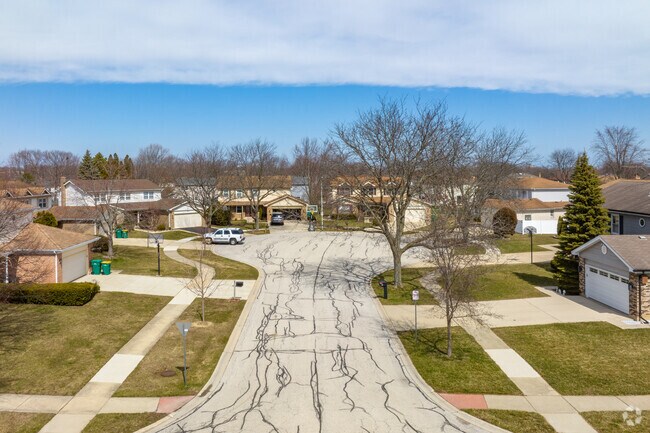
Cul De Sac Neighborhood With Sidewalks And Spacious Yards In Wheeling
Take a Hike In The Hiking Trails In Potawatomi Woods
Enjoy spacious parks and green fields in Wheeling.
Park benches sit along paved walkways in the parks of Wheeling.
Ride bikes through the paved paths in Wheeling's parks.
Median Household Income
$74,884
Average: $97,444
Education
14,267
Residents Have a Degree
Job Market
21,679
Workers Employed
Median Age
41 Years
Largest Age Group
30-39 Years
Approximately 15% of Residents
Under 20
22%
Over 65
20%
Housing Distribution
Wheeling has more homeowners than renters.

Education Distribution
Review this city's overall education levels.

As of July 2026, the average apartment rent in Wheeling, IL is $2,630 for a studio, $1,786 for one bedroom, $2,125 for two bedrooms, and $2,649 for three bedrooms. Apartment rent in Wheeling has decreased by -0.1% in the past year.
Explore how walkable, bikeable, drivable, and transit-friendly Wheeling, IL is for everyday living.
Fairly Walkable
Walkability
Limited Public Transit
Transit
Exceptionally Drivable
Drivability
Moderately Bikeable
Bikeability
Booth Tarkington Elementary School
Public
Grades PK-5
552 Students

Eugene Field Elementary School
Public
Grades PK-5
499 Students

Public
Grades PK-5
423 Students
Walt Whitman Elementary School
Public
Grades PK-5
456 Students

Public
Grades 6-8
636 Students

Public
Grades 6-8
614 Students
Public
Grades 9-12
1,588 Students
† Our analysis of utilities, groceries, transportation, healthcare, home prices, and other goods and services is sourced from the Cost of Living Index, a respected benchmark published by the Council for Community and Economic Research (C2ER) that provides a thorough overview of living expenses across different regions.
Rent data is provided by CoStar Group’s Market Trend reports. As the industry leader in commercial real estate information, analytics, and news, CoStar conducts extensive research to produce and maintain a comprehensive database of commercial real estate information. We combine this data with public record to provide the most up-to-date rental information available.
Consumer goods, services, and home prices are sourced from the Cost of Living Index published by the Council for Community and Economic Research (C2ER). The data on this page is updated quarterly. It was last published in June 2026.
Demographic information comes from Neustar and combines detailed address data with U.S. Census and American Community Survey statistics to produce reliable local estimates.


