Median Age
37 Years
Largest Age Group
15-24 Years
Approximately 15% of Residents
Under 20
26%
Over 65
14%


Area Guide
Avg Rent
$1,840
Population
55,432
Renter Mix
43% Rent
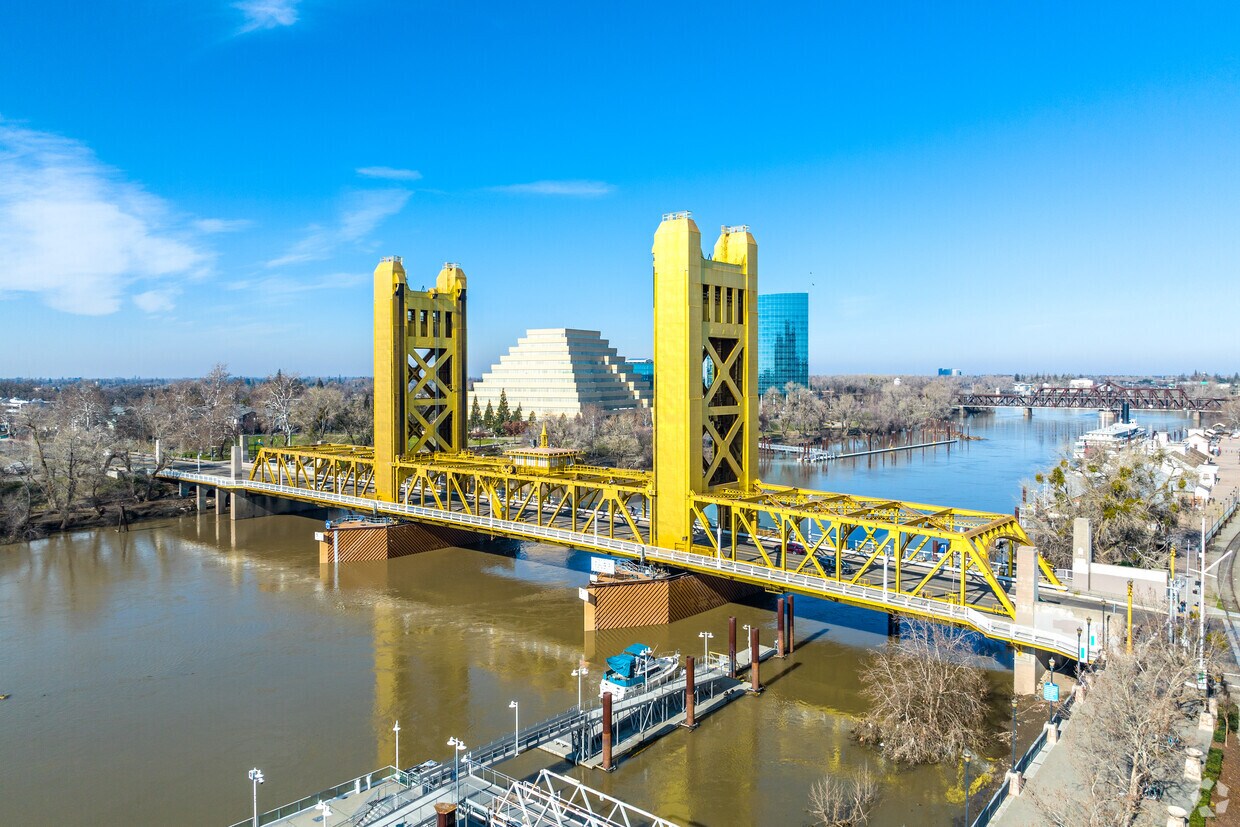
West Sacramento enjoys the unique privilege of being a fairly quiet residential community right next door to a thriving metropolis. Separated from the state capital only by the Sacramento River, West Sac (as the locals call it) shares virtually all of Sacramento’s resources, cultural and otherwise. The I Street Bridge and Tower Bridge both feed straight into Sacramento’s historic district and downtown entertainment district. On West Sacramento’s side of the river, one of the biggest attractions is the shopping, but scenic areas like River Walk Park and venues like Raley Field give folks plenty to do in their own neighborhood.
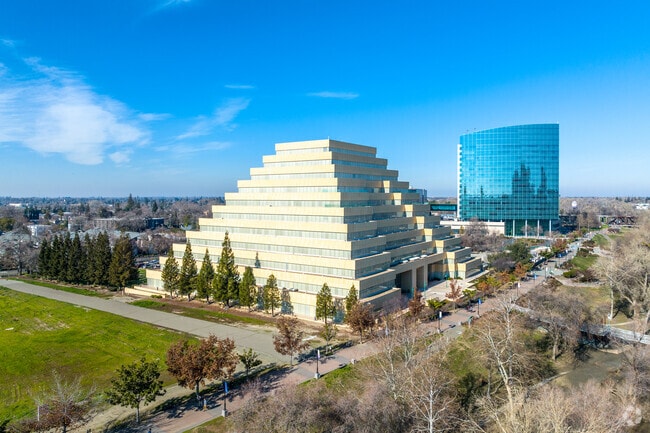
Glassy offices overlook the Ziggurat building.
You will find many vineyards in West Sacramento.
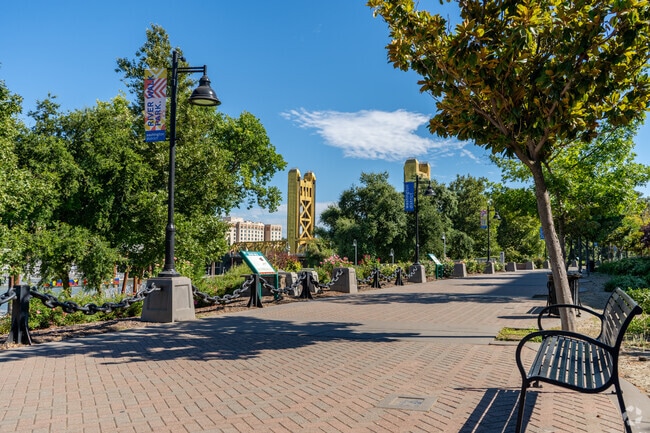
River Walk Park is a scenic place to enjoy a sunny day.
The Barn beer garden has a playground and event space off the Sacramento River.
A bike trail runs through Westfield Park.
The Riverpoint Marketplace in West Sacramento offers all the shopping choices you need.
Median Household Income
$79,759
Average: $104,500
Education
13,392
Residents Have a Degree
Job Market
28,170
Workers Employed
Median Age
37 Years
Largest Age Group
15-24 Years
Approximately 15% of Residents
Under 20
26%
Over 65
14%
Housing Distribution
West Sacramento has more homeowners than renters.

Education Distribution
Review this city's overall education levels.

As of July 2026, the average apartment rent in West Sacramento, CA is $1,755 for a studio, $1,800 for one bedroom, $2,269 for two bedrooms, and $2,812 for three bedrooms. Apartment rent in West Sacramento has decreased by -0.9% in the past year.
Explore how walkable, bikeable, drivable, and transit-friendly West Sacramento, CA is for everyday living.
Somewhat Walkable
Walkability
Exceptionally Drivable
Drivability
Fairly Bikeable
Bikeability
Public
Grades K-8
415 Students

Bridgeway Island Elementary School
Public
Grades K-8
1,062 Students

Public
Grades K-8
1,062 Students
Public
Grades K-8
928 Students

Public
Grades K-8
928 Students

Public
Grades K-8
415 Students
Bridgeway Island Elementary School
Public
Grades K-8
1,062 Students
Public
Grades K-8
1,062 Students
Public
Grades K-8
928 Students
Public
Grades K-8
928 Students
Washington Middle College High
Public
Grades 9-12
171 Students

Public
Grades 9-12
2,168 Students
Public
Grades 9-12
2,168 Students
Public
Grades 9-12
75 Students

† Our analysis of utilities, groceries, transportation, healthcare, home prices, and other goods and services is sourced from the Cost of Living Index, a respected benchmark published by the Council for Community and Economic Research (C2ER) that provides a thorough overview of living expenses across different regions.
Rent data is provided by CoStar Group’s Market Trend reports. As the industry leader in commercial real estate information, analytics, and news, CoStar conducts extensive research to produce and maintain a comprehensive database of commercial real estate information. We combine this data with public record to provide the most up-to-date rental information available.
Consumer goods, services, and home prices are sourced from the Cost of Living Index published by the Council for Community and Economic Research (C2ER). The data on this page is updated quarterly. It was last published in June 2026.
Demographic information comes from Neustar and combines detailed address data with U.S. Census and American Community Survey statistics to produce reliable local estimates.


