Median Age
35 Years
Largest Age Group
20-29 Years
Approximately 16% of Residents
Under 20
27%
Over 65
13%


Avg Rent
$1,157
Population
82,007
Renter Mix
53% Rent
The expansive suburb of Waukegan, Illinois is located on the southwest coast of Lake Michigan. It’s most popular for its beach access on Waukegan Municipal Beach, accessible by car, train, plane, bike, and boat. It stretches across 400 acres of lakefront property with a mile-long beach and large boat-slip marina. The beach is just a short walk or bike ride to and from downtown and all of its great shops and eateries. Community parks, nature preserves, and golf courses are abundant in Waukegan. Residents also have access to the Waukegan National Airport and less than an hour commute to Chicago. Find your affordable apartment in Waukegan so you can start living in this lakeside oasis.
Brick multi-story luxury homes can be found along Sheridan Road in Waukegan.
Arbor Park in Waukegan has multiple playgrounds and a paved walking trail in a wooded setting.
Independence Grove Forest Preserve is centered around a 129 acre lake and is near Waukegan.
4 miles of pathways and walking trails are found at Waukegan Sports Park.
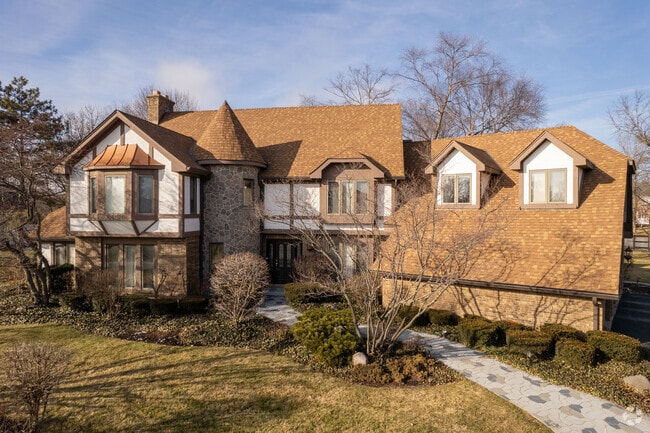
Tudor style homes can be found in Waukegan.
Boutique shops line the downtown streets of Waukegan.
Median Household Income
$60,269
Average: $78,806
Education
14,660
Residents Have a Degree
Job Market
40,493
Workers Employed
Median Age
35 Years
Largest Age Group
20-29 Years
Approximately 16% of Residents
Under 20
27%
Over 65
13%
Housing Distribution
Waukegan has more renters than homeowners.

Education Distribution
Review this city's overall education levels.

As of July 2026, the average apartment rent in Waukegan, IL is $1,140 for a studio, $1,157 for one bedroom, $1,446 for two bedrooms, and $1,588 for three bedrooms. Apartment rent in Waukegan has increased by 1.9% in the past year.
Explore how walkable, bikeable, drivable, and transit-friendly Waukegan, IL is for everyday living.
Fairly Walkable
Walkability
Limited Public Transit
Transit
Exceptionally Drivable
Drivability
Fairly Bikeable
Bikeability
John S Clark Elementary School
Public
Grades K-5
262 Students

Public
Grades K-5
420 Students

Andrew Cooke Magnet Elementary School
Public
Grades K-5
394 Students
Public
Grades K-5
438 Students

Public
Grades K-5
394 Students
Thomas Jefferson Middle School
Public
Grades 6-8
715 Students

Public
Grades 6-8
584 Students

Public
Grades 6-8
650 Students

Public
Grades 6-8
489 Students
Public
Grades 6-8
471 Students
Public
Grades 9-12
4,126 Students

† Our analysis of utilities, groceries, transportation, healthcare, home prices, and other goods and services is sourced from the Cost of Living Index, a respected benchmark published by the Council for Community and Economic Research (C2ER) that provides a thorough overview of living expenses across different regions.
Rent data is provided by CoStar Group’s Market Trend reports. As the industry leader in commercial real estate information, analytics, and news, CoStar conducts extensive research to produce and maintain a comprehensive database of commercial real estate information. We combine this data with public record to provide the most up-to-date rental information available.
Consumer goods, services, and home prices are sourced from the Cost of Living Index published by the Council for Community and Economic Research (C2ER). The data on this page is updated quarterly. It was last published in June 2026.
Demographic information comes from Neustar and combines detailed address data with U.S. Census and American Community Survey statistics to produce reliable local estimates.


