Median Age
41 Years
Largest Age Group
10-19 Years
Approximately 14% of Residents
Under 20
26%
Over 65
18%

Avg Rent
$1,185
Population
19,890
Renter Mix
14% Rent
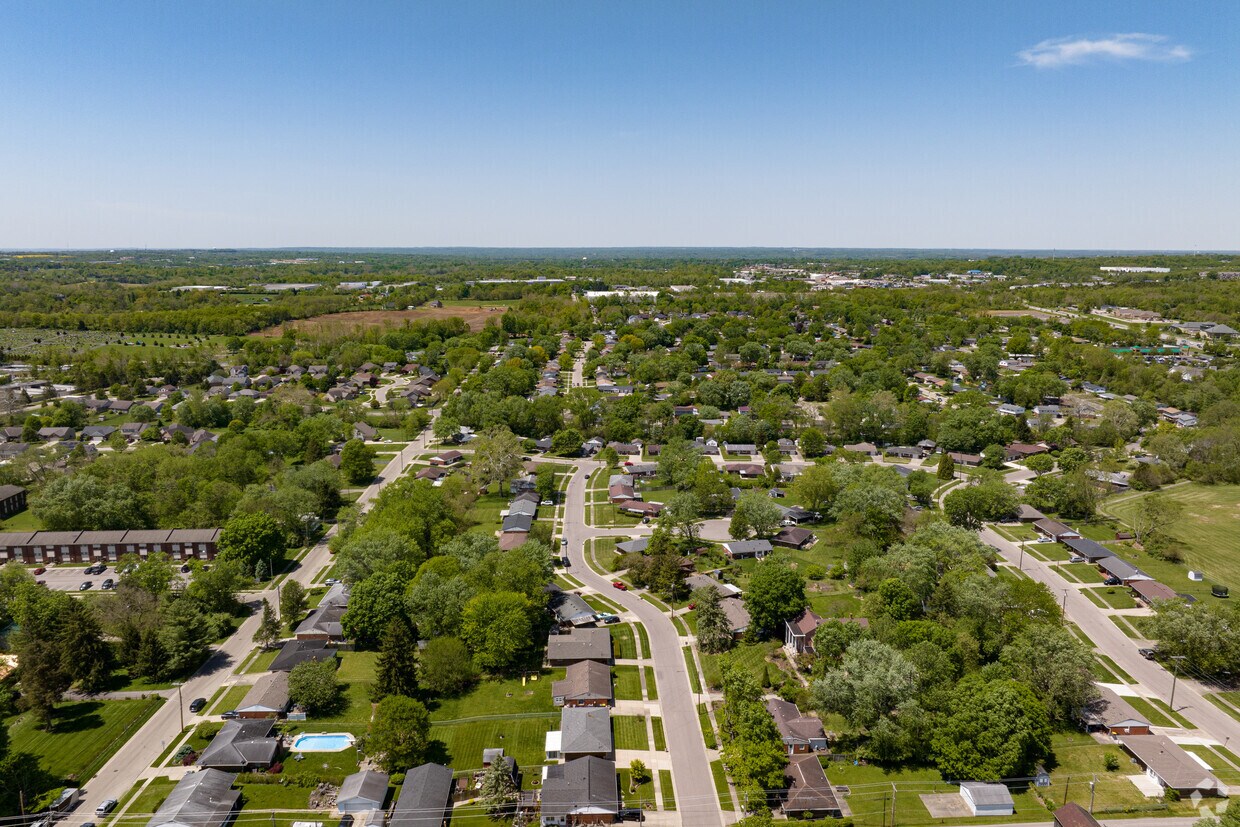
Springboro once ranked in the top 50 for best places to live in America by Money magazine, and 10th best suburb in America by Business Insider. It’s easy to see why. The area has seen continuous growth over the last few years, but remains a tranquil, family-friendly locale just minutes from Dayton.
There’s prominent arts and culture scene in Springboro, the figurehead being the La Comedia Dinner Theatre. Every year the city comes together for events like Oktoberfest and Christmas in Springsboro, two popular seasonal festivals. Great schools also bolster Springboro’s reputation, even winning a Blue-Ribbon School award in 2012.
Springboro’s wide avenues and humble homes belie its buzzing community and active arts scene. Ranch-style homes share the street with newer apartment developments, but there’s something to suit every budget and style in this Ohio gem.
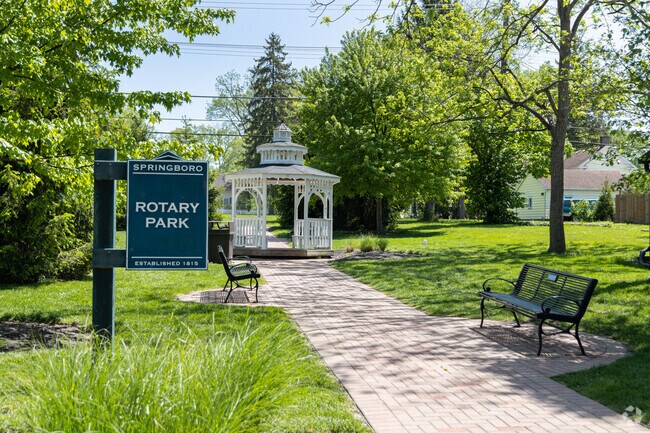
Downtown Springboro's Rotary Park features benches and a gazebo.
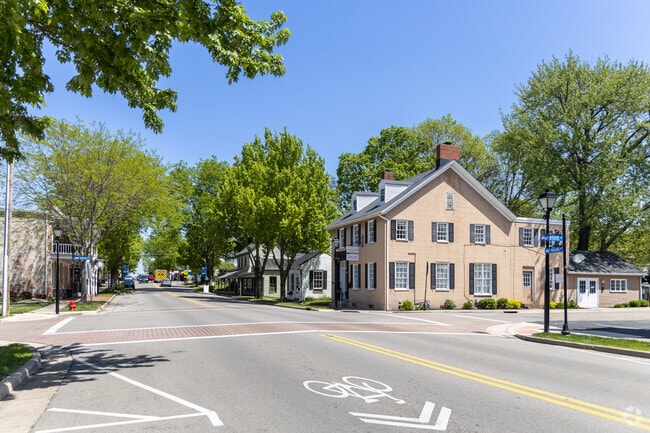
Springboro is a historic town that was once an important stop on the Underground Railroad.
Park benches at North Park make it a perfect spot for those wanting to relax.
Springboro's history is shown through restored architecture in small businesses downtown.
The swings and playground at Springboro Community Park are a popular place to play.
Historic Victorian homes can be seen along Main Street in downtown Springboro.
Median Household Income
$111,685
Average: $134,215
Education
7,671
Residents Have a Degree
Job Market
10,068
Workers Employed
Median Age
41 Years
Largest Age Group
10-19 Years
Approximately 14% of Residents
Under 20
26%
Over 65
18%
Housing Distribution
Springboro has more homeowners than renters.

Education Distribution
Review this city's overall education levels.

As of July 2026, the average apartment rent in Springboro, OH is $1,185 for one bedroom, $1,545 for two bedrooms, and $2,036 for three bedrooms. Apartment rent in Springboro has decreased by -11.3% in the past year.
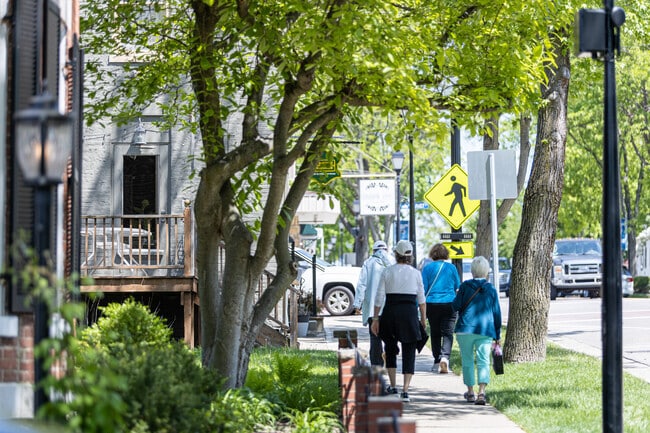
Explore how walkable, bikeable, drivable, and transit-friendly Springboro, OH is for everyday living.
Somewhat Walkable
Walkability
Very Drivable
Drivability
Fairly Bikeable
Bikeability
Public
Grades K-5
864 Students

Springboro Intermediate School
Public
Grades K-8
501 Students
Public
Grades PK-5
718 Students

Public
Grades 1-5
610 Students
Public
Grades 6-8
946 Students

Springboro Intermediate School
Public
Grades K-8
501 Students
Public
Grades 9-12
1,752 Students

† Our analysis of utilities, groceries, transportation, healthcare, home prices, and other goods and services is sourced from the Cost of Living Index, a respected benchmark published by the Council for Community and Economic Research (C2ER) that provides a thorough overview of living expenses across different regions.
Rent data is provided by CoStar Group’s Market Trend reports. As the industry leader in commercial real estate information, analytics, and news, CoStar conducts extensive research to produce and maintain a comprehensive database of commercial real estate information. We combine this data with public record to provide the most up-to-date rental information available.
Consumer goods, services, and home prices are sourced from the Cost of Living Index published by the Council for Community and Economic Research (C2ER). The data on this page is updated quarterly. It was last published in June 2026.
Demographic information comes from Neustar and combines detailed address data with U.S. Census and American Community Survey statistics to produce reliable local estimates.


