Median Age
29 Years
Largest Age Group
20-29 Years
Approximately 30% of Residents
Under 20
24%
Over 65
10%
Avg Rent
$1,156
Population
83,632
Renter Mix
68% Rent
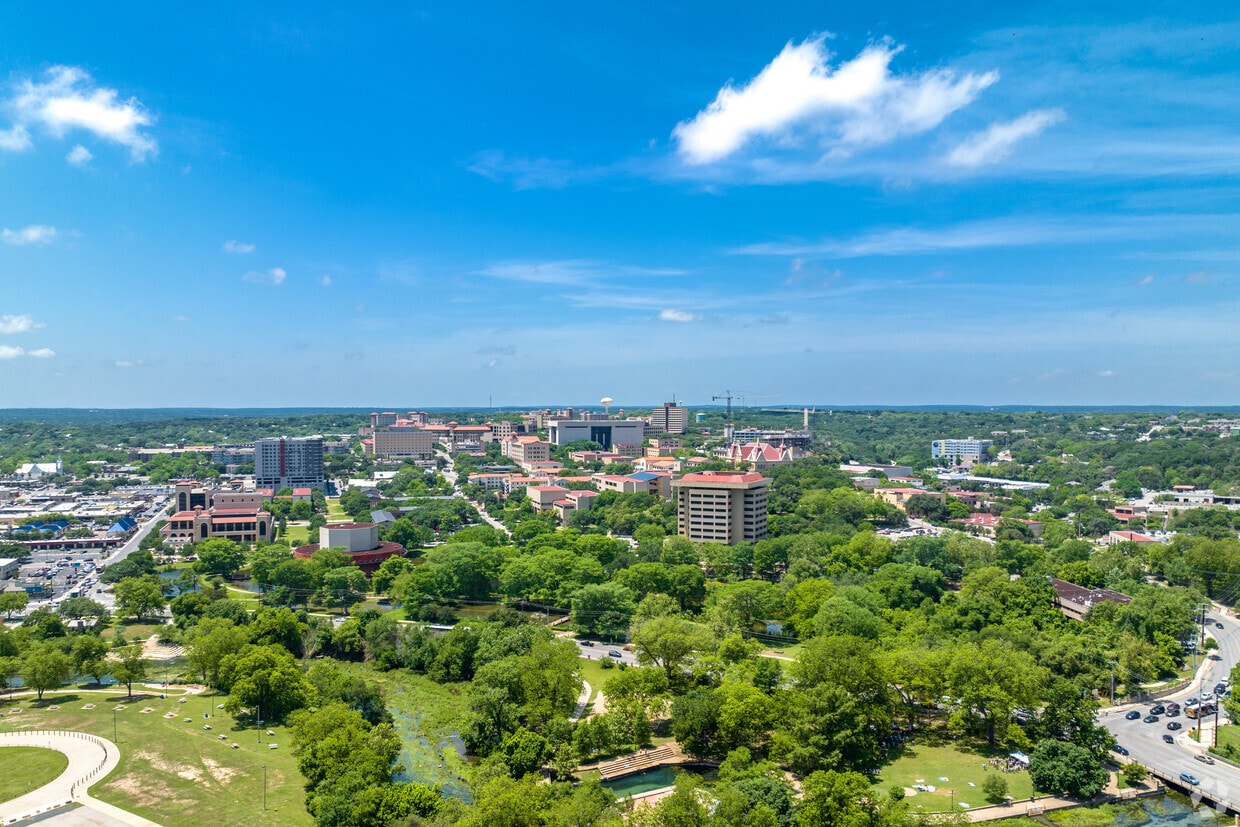
San Marcos sits right on the I-35 corridor between Austin and San Antonio, and that geography shapes almost everything about living here. The city grew up around the spring-fed San Marcos River, one of the oldest continuously inhabited sites in the Americas, and that deep sense of place still runs through the culture. Texas State University anchors the local economy and gives the city a steady pulse year-round, drawing researchers, educators, and students who settle into neighborhoods that spread well beyond the campus edge.
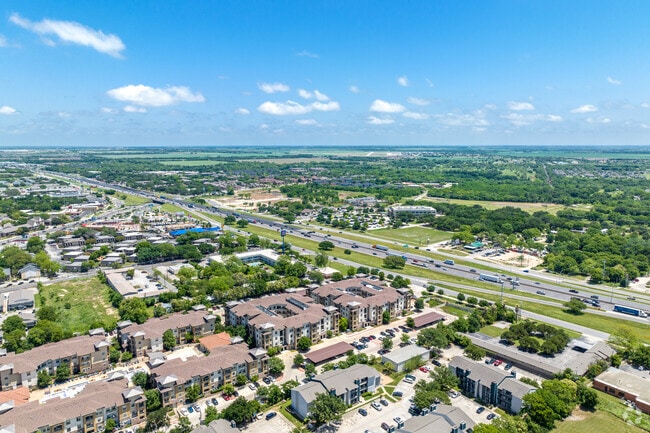
From the walkable blocks surrounding the Hays County Courthouse Square to the quieter garden-style communities near Wonder World Drive and Purgatory Creek, San Marcos offers real neighborhood variety across its 40 square miles. Renters will find a broad mix of options, including loft-style apartments downtown, apartment communities near the river corridor, and roomier townhome-style rentals toward the city's outer edges. The housing market leans accessible compared to neighboring Austin, making it a practical landing spot for anyone wanting proximity to a major metro without the price tag to match.
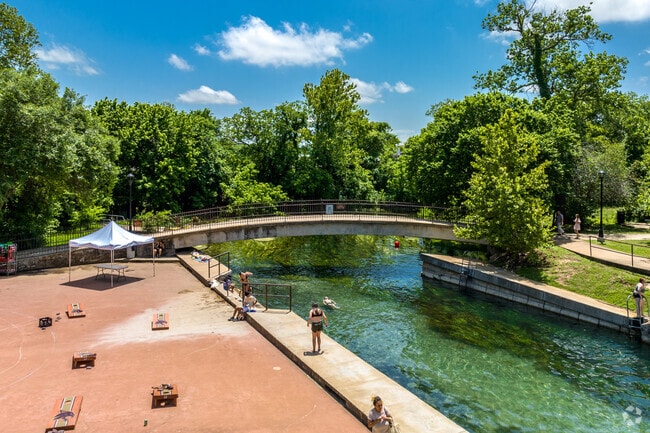
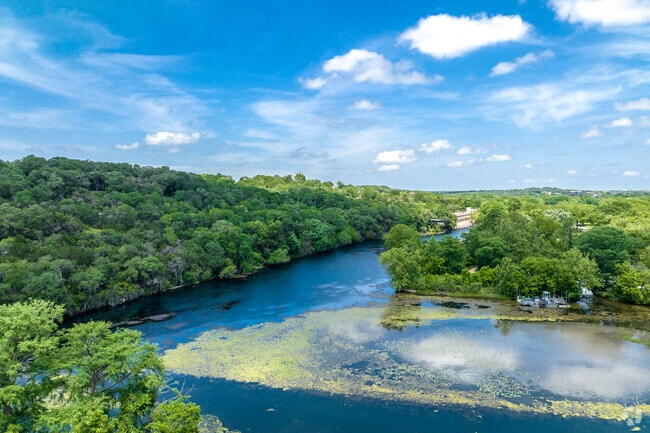
San Marcos River Next To Sewell Park In The Uptown Neighborhood Of San Marcos, TX.
San Marcos, also called San Marvelous, boasts scenic outdoor views.
Median Household Income
$35,903
Average: $58,497
Education
25,377
Residents Have a Degree
Job Market
43,436
Workers Employed
Median Age
29 Years
Largest Age Group
20-29 Years
Approximately 30% of Residents
Under 20
24%
Over 65
10%
Housing Distribution
San Marcos has more renters than homeowners.

Education Distribution
Review this city's overall education levels.

As of July 2026, the average apartment rent in San Marcos, TX is $804 for a studio, $1,158 for one bedroom, $1,354 for two bedrooms, and $1,566 for three bedrooms. Apartment rent in San Marcos has increased by 2.0% in the past year.
The cost of living in San Marcos, TX is 13.8% lower than the national average. Generally, housing in San Marcos is 23.2% less expensive than the national average, with rent falling between $804 - $1,566. You can expect to pay 7.2% less for groceries, 11.8% less for utilities, and 7.9% less for transportation.
Compare Cities
Explore how walkable, bikeable, drivable, and transit-friendly San Marcos, TX is for everyday living.
Fairly Walkable
Walkability
Exceptionally Drivable
Drivability
Fairly Bikeable
Bikeability
Public
Grades K-5
577 Students

Public
Grades K-5
525 Students
Blanco Vista Elementary School
Public
Grades PK-5
786 Students

Public
Grades K-5
498 Students
Public
Grades K-5
496 Students
Public
Grades 6-8
986 Students

Public
Grades 6-8
986 Students

Public
Grades 6-8
884 Students
Public
Grades K-12
185 Students
Public
Grades 6-8
866 Students

Public
Grades 9-12
2,371 Students
Public
Grades K-12
185 Students
† Our analysis of utilities, groceries, transportation, healthcare, home prices, and other goods and services is sourced from the Cost of Living Index, a respected benchmark published by the Council for Community and Economic Research (C2ER) that provides a thorough overview of living expenses across different regions.
Rent data is provided by CoStar Group’s Market Trend reports. As the industry leader in commercial real estate information, analytics, and news, CoStar conducts extensive research to produce and maintain a comprehensive database of commercial real estate information. We combine this data with public record to provide the most up-to-date rental information available.
Consumer goods, services, and home prices are sourced from the Cost of Living Index published by the Council for Community and Economic Research (C2ER). The data on this page is updated quarterly. It was last published in June 2026.
Demographic information comes from Neustar and combines detailed address data with U.S. Census and American Community Survey statistics to produce reliable local estimates.


