
Summerhill Terrace
15267 Hesperian Blvd,
San Leandro, CA 94578
$2,100 - $2,898
Studio - 2 Beds


San Leandro welcomes renters with its convenient East Bay location and strong sense of community. Nestled between Oakland and Hayward, this forward-looking city features a high-speed fiber optic network and growing business sector. The rental market includes everything from apartment communities near downtown to homes in established neighborhoods. One-bedroom apartments rent for $1,881 on average, while three-bedroom homes typically rent for $3,081. Bayfair Center serves as a central shopping destination, while San Leandro Marina and Lake Chabot Regional Park provide spaces for walking, hiking, and outdoor recreation.
The city has evolved from its industrial roots while preserving its rich heritage. The historic Casa Peralta stands as a testament to the area's Spanish history, and downtown San Leandro features local shops and eateries. The Portuguese community has shaped the city's character since the 1880s, contributing to its cultural landscape. With two BART stations and easy access to I-880 and I-580, residents enjoy straightforward commutes throughout the Bay Area. The Washington Manor area and Marina District are among the city's established neighborhoods, each offering distinct rental opportunities. The Zero Net Energy Center, completed in 2013, highlights the community's dedication to sustainable development.
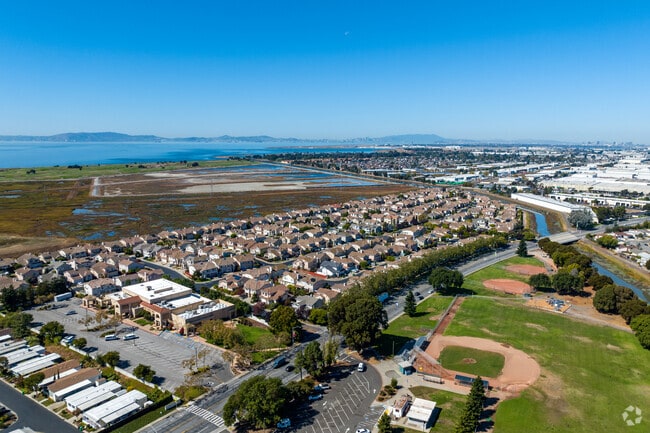
Oyster Bay Regional Shoreline's loop trail hugs the shoreline.
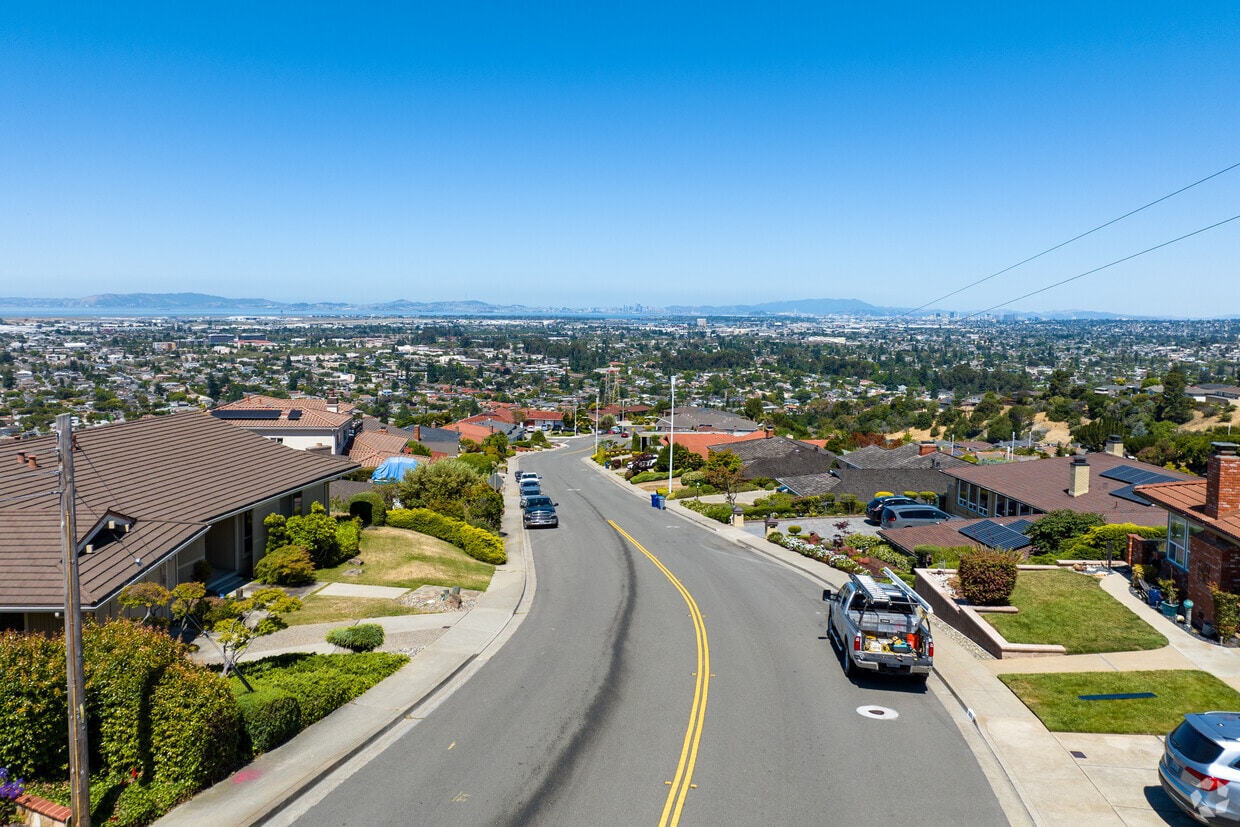
Marina Park has great views of the San Francisco skyline.
Locals prefer getting their groceries at the San Leandro Bayfair Farmers' Market.
The San Leandro BART station is within walking distance.
Chabot Park is a popular destination for disc golf enthusiasts in San Leandro.
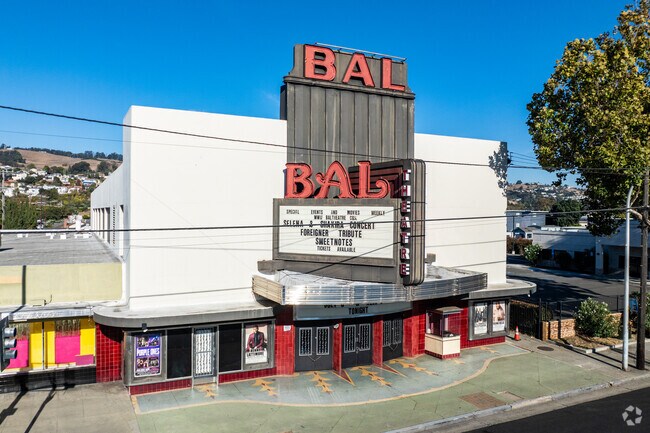
BAL Theatre’s timeless appeal makes it a San Leandro treasure for film and live events.
As of March 2026, the average apartment rent in San Leandro, CA is $1,846 for a studio, $1,876 for one bedroom, $2,279 for two bedrooms, and $2,866 for three bedrooms. Apartment rent in San Leandro has increased by 0.2% in the past year.
Explore how walkable, bikeable, drivable, and transit-friendly San Leandro, CA is for everyday living.
Very Walkable
If you enjoy walking, you’ll enjoy renting in this area! It’s a very walkable neighborhood.
Some Transit
You'll likely want a car when living in this area since it has few transit options.
Bikeable
While there’s some bike infrastructure in this area, you’ll still need a car for many errands.
Public
Grades K-5

Public
Grades K-5

Public
Grades K-5
Public
Grades K-5

Public
Grades K-5
Public
Grades 6-8
Public
Grades 6-8
Public
Grades 6-8

Public
Grades 9-12


19
Communities
1,148
Units
10
Cities

34
Communities
2,300
Units
9
Cities

12
Communities
1,349
Units
6
Cities

624
Communities
125,068
Units
245
Cities

20
Communities
3,939
Units
16
Cities

164
Communities
42,465
Units
96
Cities
† Our analysis of utilities, groceries, transportation, healthcare, home prices, and other goods and services is sourced from the Cost of Living Index, a respected benchmark published by the Council for Community and Economic Research (C2ER) that provides a thorough overview of living expenses across different regions.
Rent data is provided by CoStar Group’s Market Trend reports. As the industry leader in commercial real estate information, analytics, and news, CoStar conducts extensive research to produce and maintain a comprehensive database of commercial real estate information. We combine this data with public record to provide the most up-to-date rental information available.
Consumer goods, services, and home prices are sourced from the Cost of Living Index published by the Council for Community and Economic Research (C2ER). The data on this page is updated quarterly. It was last published in February 2026.


