Best Neighborhoods in San Jose, CA for Renters
Don't know where to start your San Jose rental search? Here are five San Jose neighborhoods perfect for renters.
Area Guide
Avg Rent
$2,791
Population
946,578
Renter Mix
47% Rent
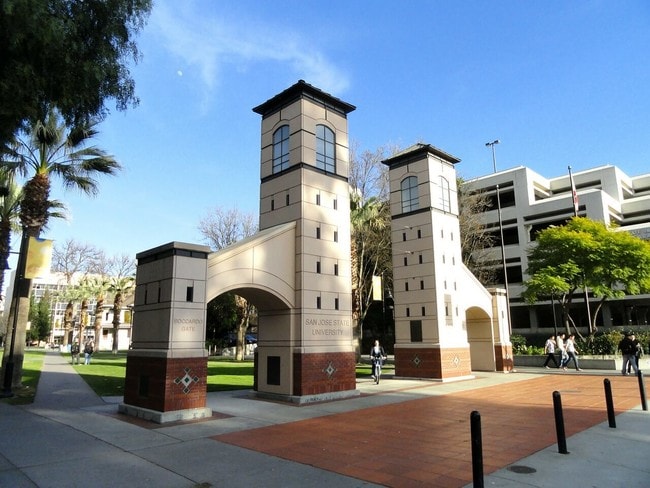
San Jose is the largest city in the San Francisco Bay Area and the beating heart of Silicon Valley, where major tech companies including Adobe, Cisco, and PayPal have long called home. Spanning 182 square miles at the southern end of the bay, it carries real weight as both an economic engine and a cultural center, anchored further by San Jose State University, whose downtown campus shapes much of the city's creative and intellectual energy. Founded in 1777 as California's first city, San Jose balances deep historical roots with an unmistakably forward-facing identity.
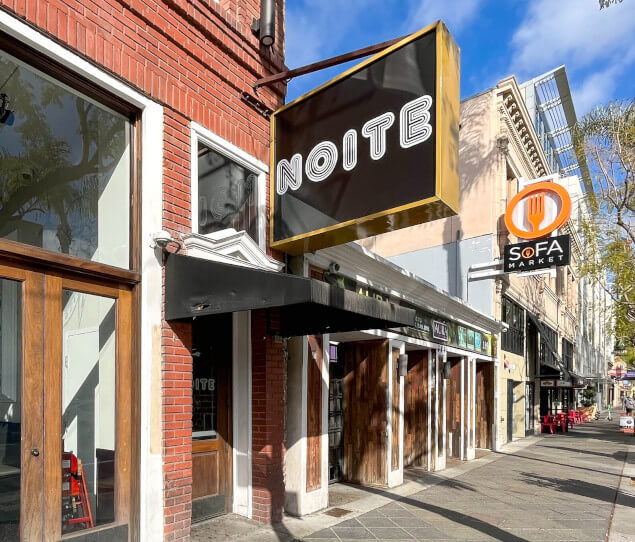
Neighborhoods here vary considerably in character. Willow Glen draws renters with tree-lined streets and a walkable village atmosphere along Lincoln Avenue, while the SoFA District and downtown offer a denser, arts-forward setting near SAP Center and The Tech Interactive. Almaden Valley sits closer to open hillside terrain, and Japantown preserves a distinct historic identity just north of downtown. The rental market reflects that range, with sleek high-rise apartment communities downtown, mid-rise buildings near transit corridors, and townhome communities spread across quieter residential pockets.
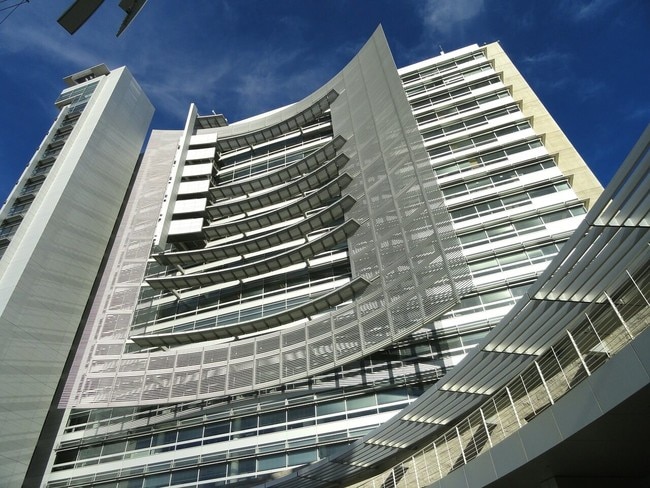
The 18-story tower of San Jose City Hall
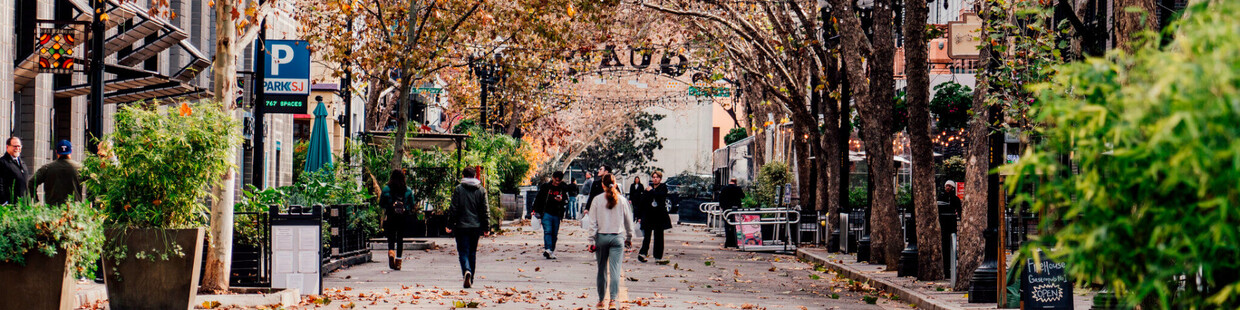
Shops and restaurants in Downtown San Jose
The beautiful and historic St. James Park is a popular downtown destination
Historic San Pedro Square is home to one of the oldest settlements in California
San Pedro Square contains several popular restaurants
The mysterious Winchester Mystery House
Median Household Income
$130,163
Average: $159,255
Education
352,352
Residents Have a Degree
Job Market
508,378
Workers Employed
Median Age
39 Years
Largest Age Group
30-39 Years
Approximately 15% of Residents
Under 20
22%
Over 65
16%
Housing Distribution
San Jose has more homeowners than renters.

Education Distribution
Review this city's overall education levels.

As of June 2026, the average apartment rent in San Jose, CA is $2,399 for a studio, $2,793 for one bedroom, $3,501 for two bedrooms, and $4,273 for three bedrooms. Apartment rent in San Jose has increased by 4.5% in the past year.
The cost of living in San Jose, CA is 83.9% higher than the national average. Generally, housing in San Jose is 230.4% more expensive than the national average, with rent falling between $2,397 - $4,283. You can expect to pay 10.4% more for groceries, 42.7% more for utilities, and 36.6% more for transportation.
Compare Cities
Best Neighborhoods in San Jose, CA for Renters
Don't know where to start your San Jose rental search? Here are five San Jose neighborhoods perfect for renters.

Why Are Renters Choosing to Lease Long-Term?
Rising home prices are making long-term renting a smart choice. See why renters are choosing to lease long-term.

Moving This Spring? The Ultimate Apartment Moving Checklist
Your apartment moving checklist, week by week—from decluttering months in advance to your very last night.
Explore how walkable, bikeable, drivable, and transit-friendly San Jose, CA is for everyday living.
Fairly Walkable
Walkability
Some Public Transit
Transit
Exceptionally Drivable
Drivability
Moderately Bikeable
Bikeability
Public
Grades K-8
952 Students

Tom Matsumoto Elementary School
Public
Grades K-5
727 Students
Public
Grades K-8
723 Students
Public
Grades K-5
627 Students
James Franklin Smith Elementary School
Public
Grades K-5
595 Students
Public
Grades 6-8
1,068 Students
Public
Grades K-8
952 Students
Public
Grades K-8
723 Students
Public
Grades 6-8
213 Students
Public
Grades 6-8
1,068 Students

Public
Grades 9-12
2,703 Students
Public
Grades 9-12
2,703 Students
Public
Grades 9-12
1,918 Students
Public
Grades 9-12
1,918 Students
Public
Grades 9-12
1,884 Students
† Our analysis of utilities, groceries, transportation, healthcare, home prices, and other goods and services is sourced from the Cost of Living Index, a respected benchmark published by the Council for Community and Economic Research (C2ER) that provides a thorough overview of living expenses across different regions.
Rent data is provided by CoStar Group’s Market Trend reports. As the industry leader in commercial real estate information, analytics, and news, CoStar conducts extensive research to produce and maintain a comprehensive database of commercial real estate information. We combine this data with public record to provide the most up-to-date rental information available.
Consumer goods, services, and home prices are sourced from the Cost of Living Index published by the Council for Community and Economic Research (C2ER). The data on this page is updated quarterly. It was last published in June 2026.
Demographic information comes from Neustar and combines detailed address data with U.S. Census and American Community Survey statistics to produce reliable local estimates.


