7 Best Places to Live in Massachusetts
Open to exploring your options? Discover other great cities in Massachusetts with our detailed guide.
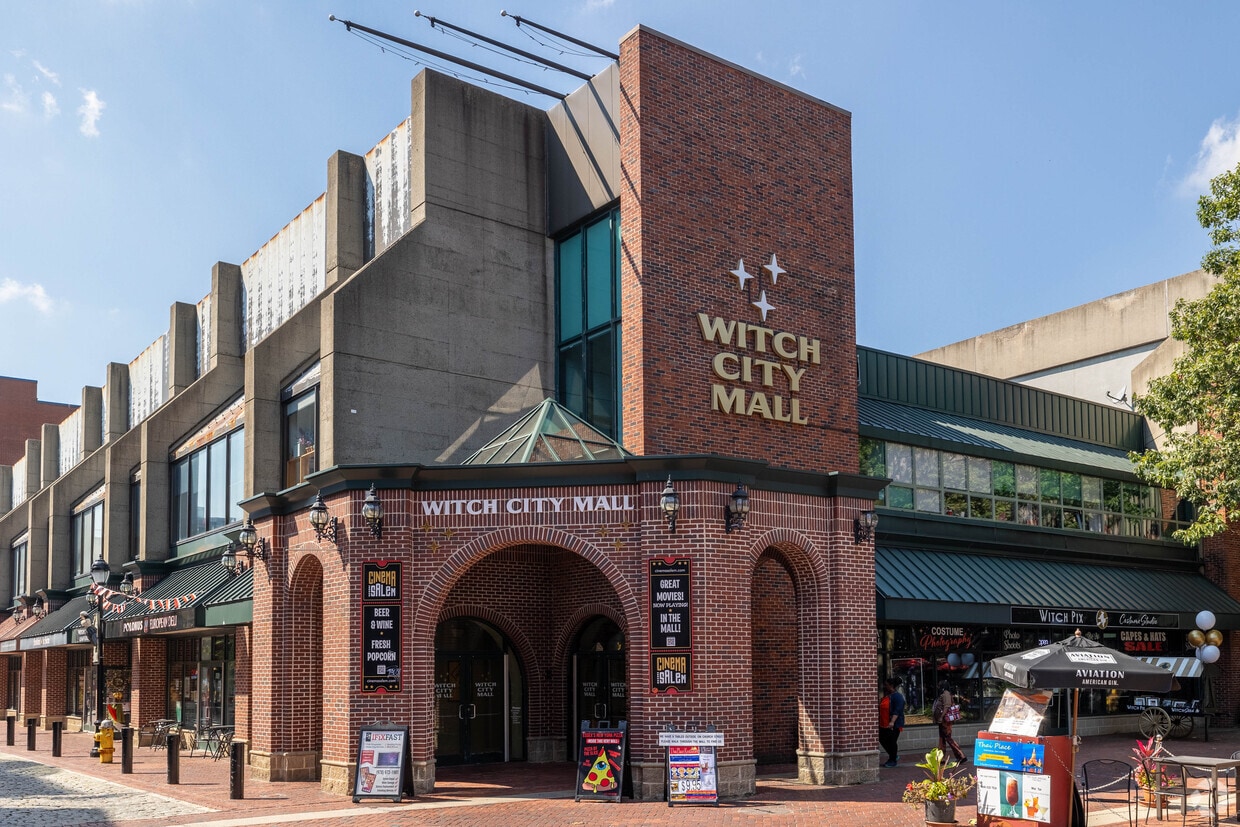
Welcome to Salem, Massachusetts, a historic coastal city known for its maritime heritage and centuries-old architecture. Located just 16 miles north of Boston, Salem has approximately 44,480 residents and offers housing options ranging from historic properties in the Chestnut Street District to residential communities in South Salem and the Salem Neck area. Current rental rates average $2,173 for one-bedroom apartments and $2,634 for two-bedrooms.
Salem's downtown district features the internationally acclaimed Peabody Essex Museum and the Derby Waterfront District, home to the seasonal Salem Ferry terminal. The Salem Willows neighborhood offers waterfront parks and recreational areas, while Winter Island Marine Park and Forest River Conservation Area provide outdoor spaces for walking and wildlife viewing. Salem Common, site of the first National Guard muster in 1637, remains a central gathering space. The city offers convenient transportation options, including MBTA commuter rail service to Boston and local bus routes connecting neighborhoods throughout Salem.
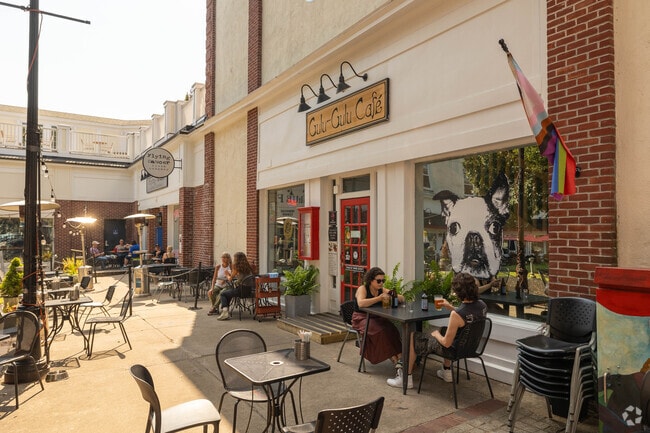
The outdoor patio at Gulu Gulu is great for people watching when visiting Salem.
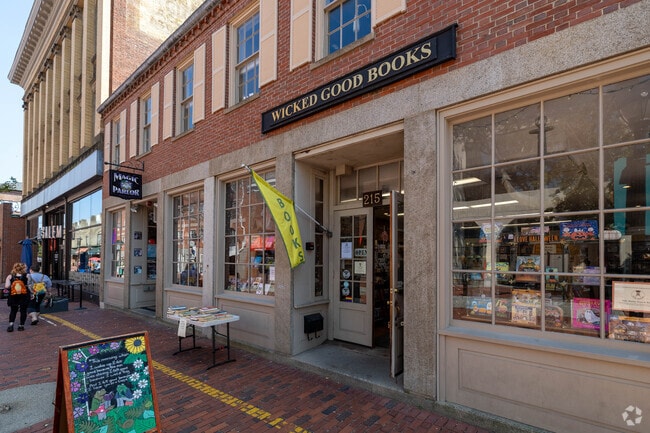
Wicked Good Books in Salem is a small locally owned bookstore with a number of great gift ideas.
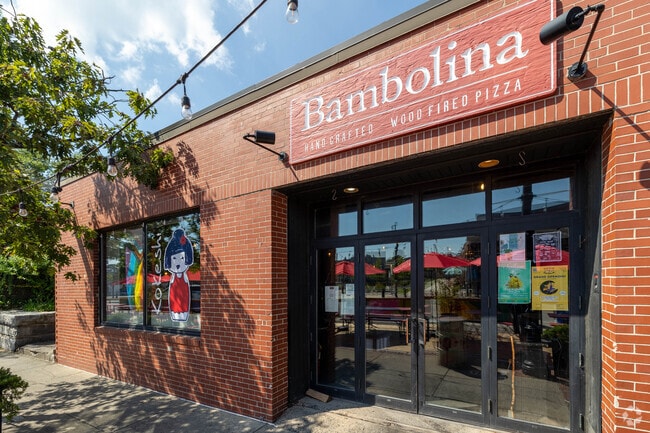
If you're hungry for pizza or asian food when visiting Salem check out Bambolina and Kokeshi.
A number of local produce stands are greet to visitors when visiting the Salem Farmers Market.
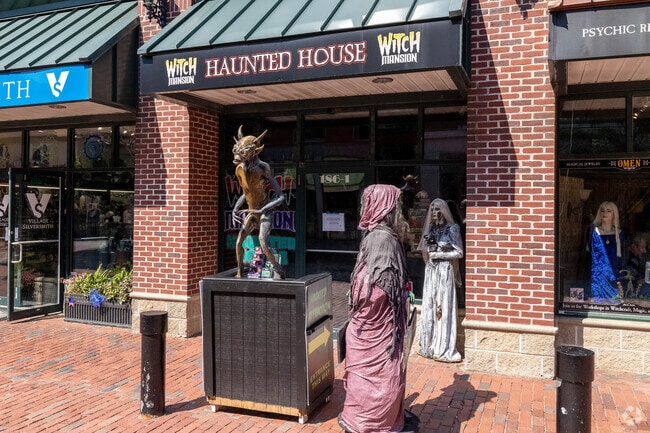
The crowd is amazed by the aerial acrobatics at the Haunted Happenings Marketplace.
2 Cyrstal tarot
As of March 2026, the average apartment rent in Salem, MA is $1,654 for a studio, $2,195 for one bedroom, $2,671 for two bedrooms, and $3,165 for three bedrooms. Apartment rent in Salem has decreased by -2.1% in the past year.
Open to exploring your options? Discover other great cities in Massachusetts with our detailed guide.
Explore how walkable, bikeable, drivable, and transit-friendly Salem, MA is for everyday living.
Very Walkable
If you enjoy walking, you’ll enjoy renting in this area! It’s a very walkable neighborhood.
Some Transit
You'll likely want a car when living in this area since it has few transit options.
Bikeable
While there’s some bike infrastructure in this area, you’ll still need a car for many errands.
Public
Grades PK-5

Public
Grades K-8

Public
Grades K-5
Witchcraft Heights Elementary School
Public
Grades K-5
Public
Grades PK-5

Public
Grades 6-12
Public
Grades 6-8

Public
Grades K-8
Public
Grades K-8
378 Students
Public
Grades 6-12
Public
Grades 9-12

Salem - New Liberty Innovation School
Public
Grades 9-12

Public
Grades 9-12


3,490
Communities
959,772
Units
895
Cities

715
Communities
198,674
Units
340
Cities

23
Communities
2,351
Units
17
Cities

209
Communities
67,041
Units
114
Cities

159
Communities
26,767
Units
111
Cities

62
Communities
14,822
Units
46
Cities
† Our analysis of utilities, groceries, transportation, healthcare, home prices, and other goods and services is sourced from the Cost of Living Index, a respected benchmark published by the Council for Community and Economic Research (C2ER) that provides a thorough overview of living expenses across different regions.
Rent data is provided by CoStar Group’s Market Trend reports. As the industry leader in commercial real estate information, analytics, and news, CoStar conducts extensive research to produce and maintain a comprehensive database of commercial real estate information. We combine this data with public record to provide the most up-to-date rental information available.
Consumer goods, services, and home prices are sourced from the Cost of Living Index published by the Council for Community and Economic Research (C2ER). The data on this page is updated quarterly. It was last published in February 2026.


