
1000 Chestnut Street Apartments
1000 Chestnut St,
San Francisco, CA 94109
Call for Rent
Studio - 3 Beds


If you’ve always wondered what it’s like to “walk a crooked mile,” take a stroll along Lombard Street in Russian Hill! Of course, this landmark street isn’t a mile long – it’s only 600 feet – but it’s impressive nonetheless. This popular tourist destination offers amazing views, but it isn’t the only great thing about living in Russian Hill. From the base and Ghirardelli Square to the views from the top of Lombard Street, and from the famous Hyde Street cable car to Russian Hill Park, it’s easy to see why Russian Hill is one of San Francisco’s favorite neighborhoods.
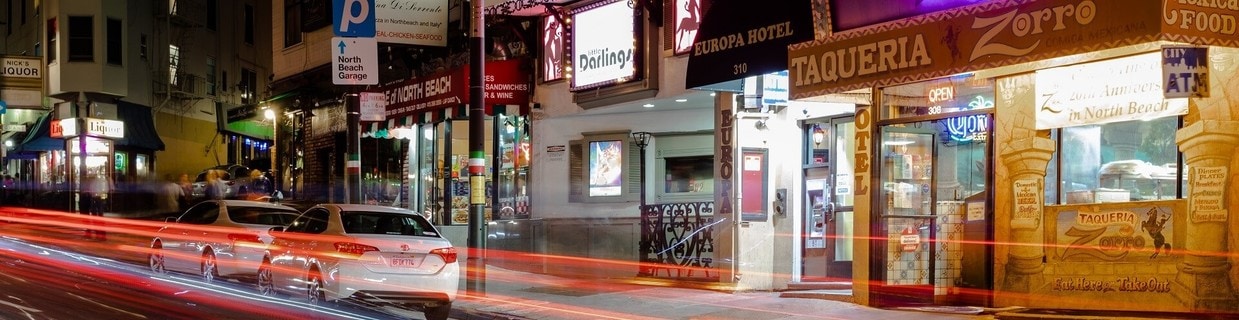
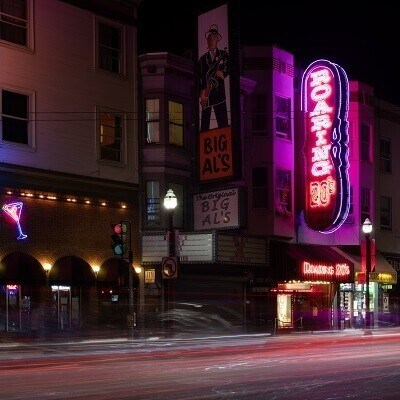
If you don’t mind the steep grade, Russian Hill is within walking distance to Chinatown, North Beach, Pacific Heights, and the Marina. The views from the neighborhood are amazing, from the bay to Alcatraz. Other nearby destinations include Fisherman’s Warf, the San Francisco Maritime National Historical Park, and the San Francisco Art Institute. Great destinations in Russian Hill include Hyde & Vallejo Mini Park, the First Swensen’s Ice Cream Store, Elephant Sushi, and Za Pizza.
Enjoy great views of the Golden Gate Bridge from the Maritime Garden
A view of Coit Tower from Russian Hill
The statue of Benjamin Franklin in Washington Square was first installed in 1879
Lombard Street features eight sharp turns
The Transamerica Pyramid in the Financial District stands 48 stories tall
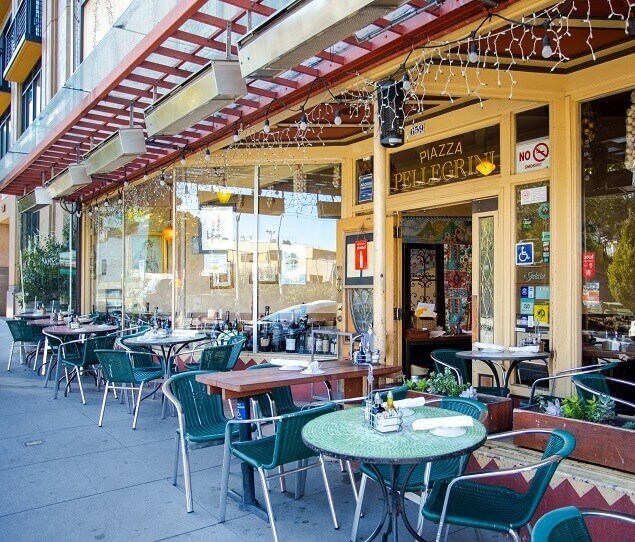
The Piazza Pellegrini is famous for its antipasti, pizzas, and pasta
As of March 2026, the average apartment rent in Russian Hill is $2,371 for a studio, $3,081 for one bedroom, $4,421 for two bedrooms, and $6,026 for three bedrooms. Apartment rent in Russian Hill has increased by 3.8% in the past year.
Studio
435 sq ft
Average Sq Ft
$2,371/month
Average Rent
1 BR
498 sq ft
Average Sq Ft
$3,081/month
Average Rent
2 BR
679 sq ft
Average Sq Ft
$4,421/month
Average Rent
3 BR
875 sq ft
Average Sq Ft
$6,026/month
Average Rent
Explore how walkable, bikeable, drivable, and transit-friendly Russian Hill - San Francisco, CA is for everyday living.
Walker's Paradise
Lace up your walking shoes because this area is considered a walker’s paradise.
Excellent Transit
You’ll have excellent transit living in this area, with several nearby transit stops.
Very Bikeable
This area is very bikeable. You’ll find a variety of bike paths and lanes.
Niche User
10 years and 10 months ago•Niche Review
Jobs are plenty in the area. There are various types of jobs from stocking groceries, working in a dry cleaner, busing at a restaurant, and public health services around the area. It is easy to find a job that pays minimum or even below, but to find a really good job that pays above minimum wage it is hard.
Niche User
10 years and 10 months ago•Niche Review
The housing and apartments here are not the best, but it is bearable.
Niche User
10 years and 10 months ago•Niche Review
There are a great variety of foods around the area, especially Asian culture foods.
Niche User
10 years and 10 months ago•Niche Review
This place has the best weather ever! I love how it does not get too hot nor too cold.

3,487
Communities
959,069
Units
894
Cities

715
Communities
198,674
Units
340
Cities

624
Communities
174,107
Units
248
Cities

624
Communities
125,068
Units
245
Cities

554
Communities
124,135
Units
220
Cities

457
Communities
108,184
Units
229
Cities
† Our analysis of utilities, groceries, transportation, healthcare, home prices, and other goods and services is sourced from the Cost of Living Index, a respected benchmark published by the Council for Community and Economic Research (C2ER) that provides a thorough overview of living expenses across different regions.
Rent data is provided by CoStar Group’s Market Trend reports. As the industry leader in commercial real estate information, analytics, and news, CoStar conducts extensive research to produce and maintain a comprehensive database of commercial real estate information. We combine this data with public record to provide the most up-to-date rental information available.
Consumer goods, services, and home prices are sourced from the Cost of Living Index published by the Council for Community and Economic Research (C2ER). The data on this page is updated quarterly. It was last published in February 2026.


