Median Age
38 Years
Largest Age Group
20-29 Years
Approximately 15% of Residents
Under 20
25%
Over 65
20%


Area Guide
Avg Rent
$694
Population
37,191
Renter Mix
38% Rent
Forming the southwest corner of the Quad Cities area on the Illinois/Iowa border, Rock Island shares many cultural resources with its neighboring cities, particularly Moline and Davenport. The city oversees more than 850 acres of public parkland, giving residents lots of options for outdoor recreation. Rock Island also features bike lanes across the city, making it easy for cyclists to get around town.
The part of downtown known as The District is the cultural epicenter of Rock Island, home to art galleries, performance venues, and world-class dining and nightlife. The District is also where you’ll find festivals and other outdoor events happening year-round, celebrating everything from Mardi Gras to America’s largest go-kart street race.
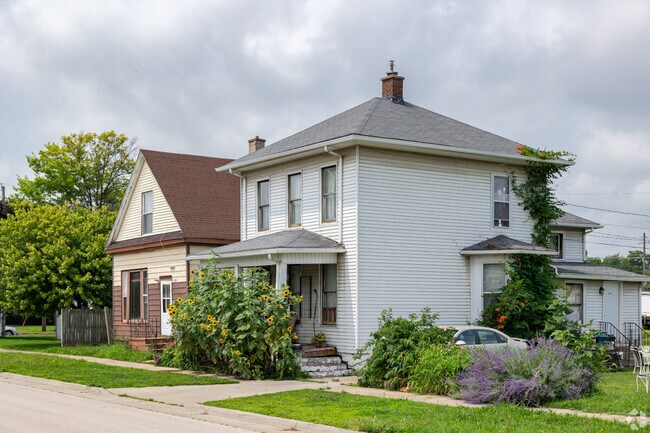
Downtown Rock Island homes are built in familiar styles, from four-squares to bungalows.
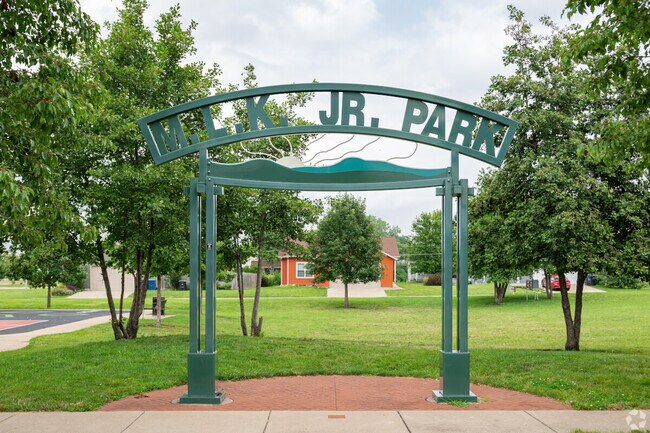
Martin Luther King Jr. Park is one of several community parks in the Douglas Park neighborhood.
Residents will find artistic murals on the sides of many buildings in Downtown Rock Island.
Median Household Income
$51,176
Average: $64,761
Education
7,093
Residents Have a Degree
Job Market
17,025
Workers Employed
Median Age
38 Years
Largest Age Group
20-29 Years
Approximately 15% of Residents
Under 20
25%
Over 65
20%
Housing Distribution
Rock Island has more homeowners than renters.

Education Distribution
Review this city's overall education levels.

The cost of living in Rock Island, IL is 8.6% lower than the national average. Generally, housing in Rock Island is 18.7% less expensive than the national average, with rent falling between $0 - $0. You can expect to pay 2.9% less for groceries, 19.7% less for utilities, and 4.8% more for transportation.
Compare Cities
Explore how walkable, bikeable, drivable, and transit-friendly Rock Island, IL is for everyday living.
Somewhat Walkable
Walkability
Minimal Public Transit
Transit
Exceptionally Drivable
Drivability
Moderately Bikeable
Bikeability
Public
Grades K-5
339 Students

Public
Grades PK-5
276 Students
Rock Island Center for Math and Science
Public
Grades PK-5
498 Students

Eugene Field Elementary School
Public
Grades K-5
462 Students
Frances Willard Elementary School
Public
Grades PK-5
287 Students
Public
Grades 6-8
515 Students

Public
Grades 6-8
393 Students

Public
Grades 6-8

Public
Grades 9-12
1,700 Students

† Our analysis of utilities, groceries, transportation, healthcare, home prices, and other goods and services is sourced from the Cost of Living Index, a respected benchmark published by the Council for Community and Economic Research (C2ER) that provides a thorough overview of living expenses across different regions.
Rent data is provided by CoStar Group’s Market Trend reports. As the industry leader in commercial real estate information, analytics, and news, CoStar conducts extensive research to produce and maintain a comprehensive database of commercial real estate information. We combine this data with public record to provide the most up-to-date rental information available.
Consumer goods, services, and home prices are sourced from the Cost of Living Index published by the Council for Community and Economic Research (C2ER). The data on this page is updated quarterly. It was last published in June 2026.
Demographic information comes from Neustar and combines detailed address data with U.S. Census and American Community Survey statistics to produce reliable local estimates.


