


Median Age
40 Years
Largest Age Group
30-39 Years
Approximately 14% of Residents
Under 20
24%
Over 65
22%


Avg Rent
$865
Population
41,504
Renter Mix
38% Rent
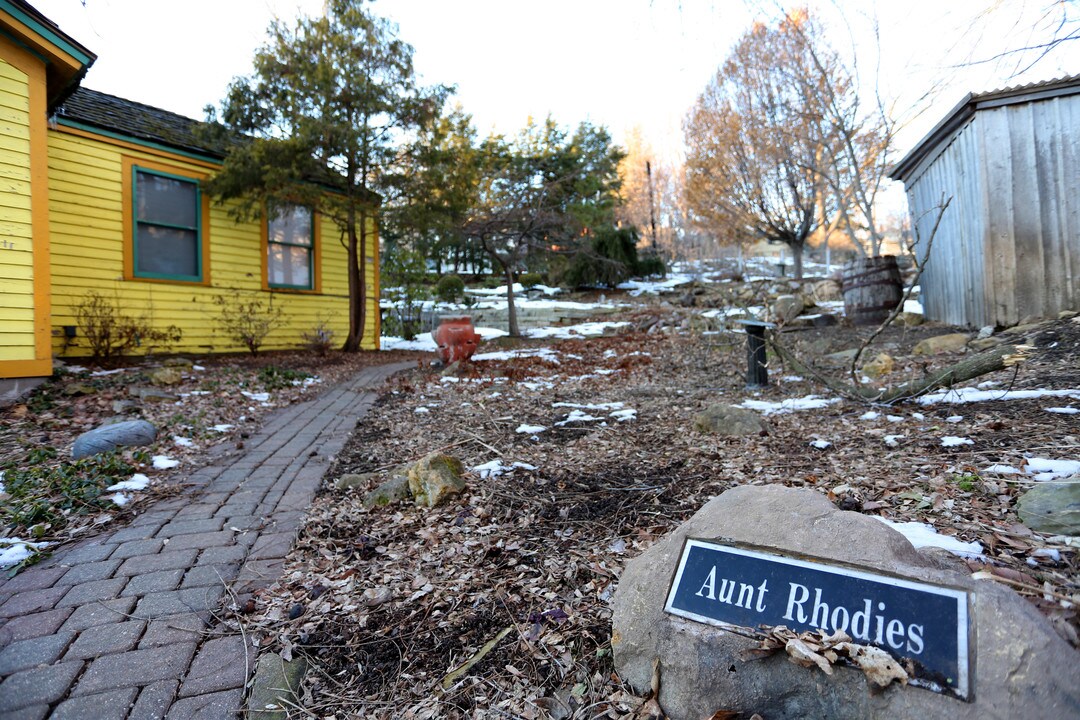
Moline sits where the Rock and Mississippi rivers converge, giving this Illinois city a genuine connection to the water that shapes everyday life here. Part of the greater Quad Cities region alongside Rock Island, Davenport, and Bettendorf, Moline carries a strong sense of place rooted in industrial history. The city is home to the global headquarters of Deere & Company, and the John Deere Pavilion draws visitors year-round as a true landmark attraction. Downtown Moline's Historic District showcases striking architecture while offering dining and entertainment options within a walkable stretch. Outdoor enthusiasts have plenty to explore, from the city's five boat launches and marina to miles of riverfront trails perfect for cycling and weekend strolls.
The rental market here offers solid variety, with traditional apartment communities, spacious townhomes, and smaller multifamily buildings spread across established neighborhoods. Western Illinois University's Quad Cities campus adds an academic energy to the area. Established in 1843, Moline takes its name from the French word "moulin," meaning mill town, a nod to the waterways that first powered its growth. Renters looking for Midwest livability without the big-city price tag will find Moline well worth a closer look.
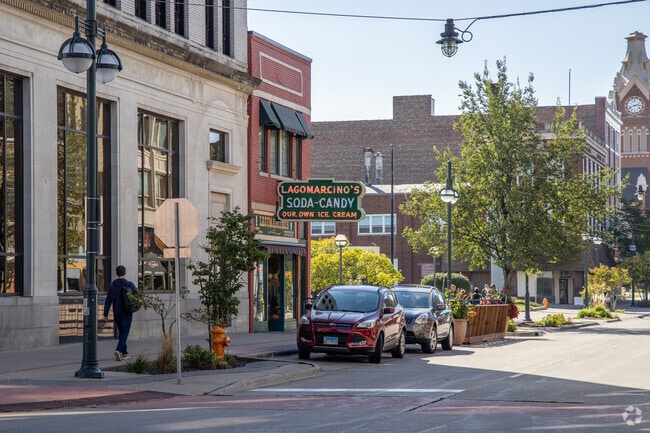
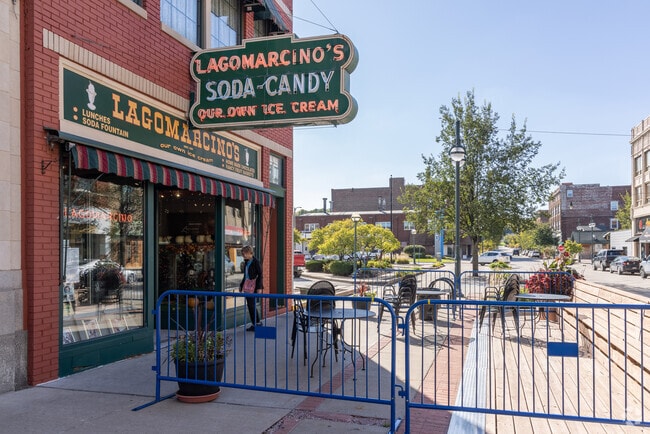
Downtown Moline is an easily walkable city and offers a variety of shops and eateries.
Lagomaercino's has been serving treats in Downtown Moline since 1908.
The John Deere Pavilion and Museum is a major attraction in downtown Moline.
The Deere-Wiman House near Stephens Park was built by the son of industry icon John Deere.
A view of the Mississippi from the Ben Butterworth Parkway in East End.
The Celebration River Cruises offers a beautiful dinner cruise in East End.
Median Household Income
$58,975
Average: $72,763
Education
10,147
Residents Have a Degree
Job Market
20,057
Workers Employed
Median Age
40 Years
Largest Age Group
30-39 Years
Approximately 14% of Residents
Under 20
24%
Over 65
22%
Housing Distribution
Moline has more homeowners than renters.

Education Distribution
Review this city's overall education levels.

As of July 2026, the average apartment rent in Moline, IL is $615 for a studio, $865 for one bedroom, $1,017 for two bedrooms, and $1,383 for three bedrooms. Apartment rent in Moline has increased by 0.4% in the past year.
The cost of living in Moline, IL is 8.6% lower than the national average. Generally, housing in Moline is 18.7% less expensive than the national average, with rent falling between $615 - $1,383. You can expect to pay 2.9% less for groceries, 19.7% less for utilities, and 4.8% more for transportation.
Compare Cities
Explore how walkable, bikeable, drivable, and transit-friendly Moline, IL is for everyday living.
Fairly Walkable
Walkability
Some Public Transit
Transit
Exceptionally Drivable
Drivability
Fairly Bikeable
Bikeability
Benjamin Franklin Elementary School
Public
Grades K-5
281 Students

Public
Grades PK-5
566 Students

Public
Grades K-5
290 Students
Public
Grades PK-5
409 Students

Public
Grades PK-5
265 Students
Public
Grades 6-8
850 Students
Public
Grades 6-8
761 Students

Public
Grades 6-8

Public
Grades 9-12
2,189 Students
† Our analysis of utilities, groceries, transportation, healthcare, home prices, and other goods and services is sourced from the Cost of Living Index, a respected benchmark published by the Council for Community and Economic Research (C2ER) that provides a thorough overview of living expenses across different regions.
Rent data is provided by CoStar Group’s Market Trend reports. As the industry leader in commercial real estate information, analytics, and news, CoStar conducts extensive research to produce and maintain a comprehensive database of commercial real estate information. We combine this data with public record to provide the most up-to-date rental information available.
Consumer goods, services, and home prices are sourced from the Cost of Living Index published by the Council for Community and Economic Research (C2ER). The data on this page is updated quarterly. It was last published in June 2026.
Demographic information comes from Neustar and combines detailed address data with U.S. Census and American Community Survey statistics to produce reliable local estimates.


