Median Age
34 Years
Largest Age Group
25-34 Years
Approximately 17% of Residents
Under 20
26%
Over 65
12%

Avg Rent
$1,902
Population
315,768
Renter Mix
46% Rent
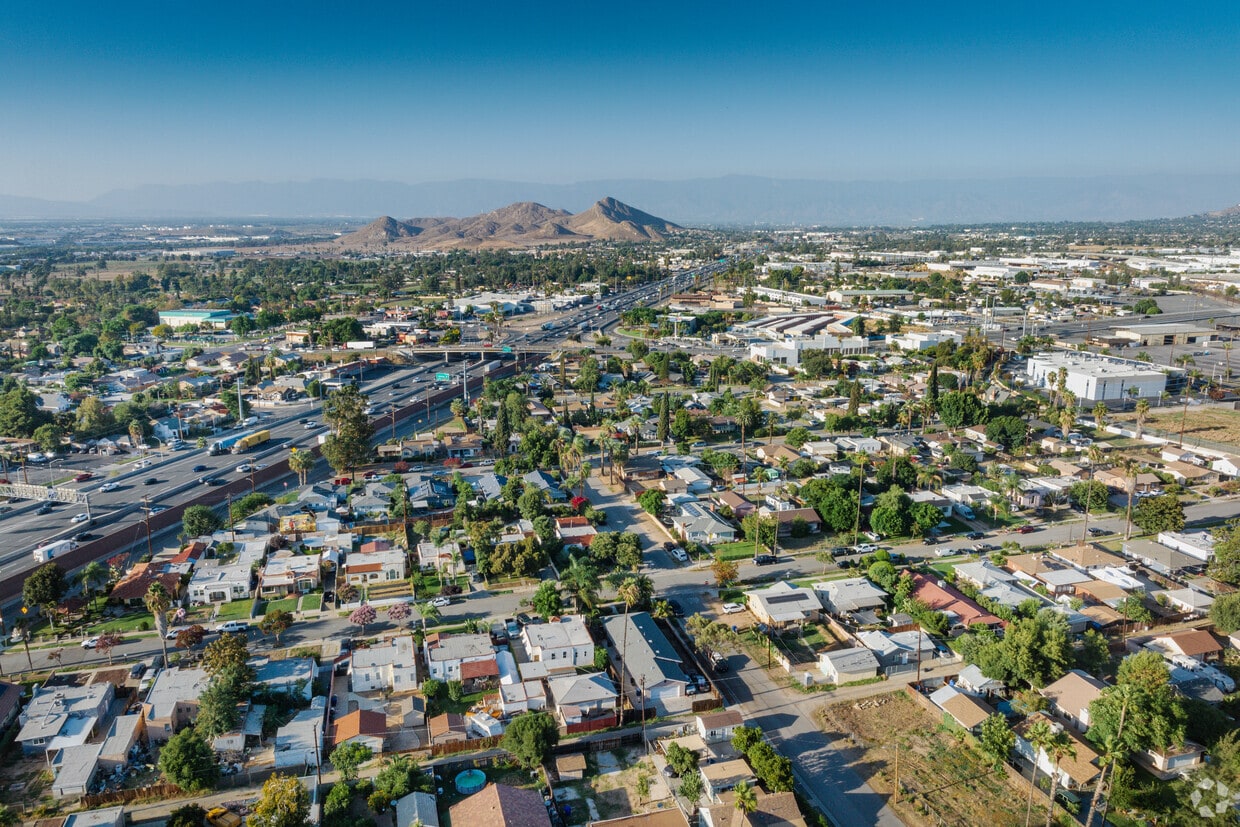
Riverside earned its place on the map as the birthplace of California's navel orange industry, and that history still shapes the city's character in ways you can see and feel today. As the county seat and most populous city in the Inland Empire, Riverside carries the energy of a regional hub while holding onto a distinctive sense of place rooted in historic architecture and civic pride. The University of California, Riverside anchors the northeastern part of the city and draws a steady stream of research, healthcare, and education activity that feeds the broader economy. Major employers also include Riverside Community Hospital and county government offices downtown.
Neighborhoods here offer real variety. The Wood Streets deliver tree-lined blocks and well-preserved Craftsman homes near Riverside Plaza, while Canyon Crest sits alongside open wilderness with access to Sycamore Canyon. The University district keeps things close to campus, and La Sierra offers a more suburban pace near the Galleria at Tyler. Downtown remains the cultural and civic core, anchored by the Mission Inn Hotel and the Fox Performing Arts Center. Renters will find a wide range of options across the city, from apartment communities in newer suburban corridors to historic rental homes and garden-style buildings near the university.
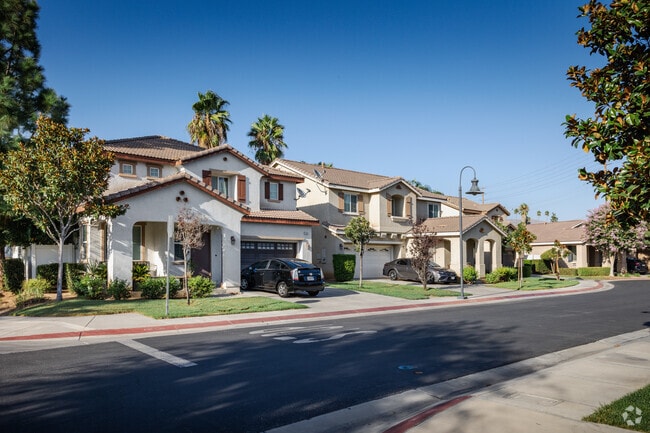
Spanish-style homes line Hunter Industrial Park's streets.
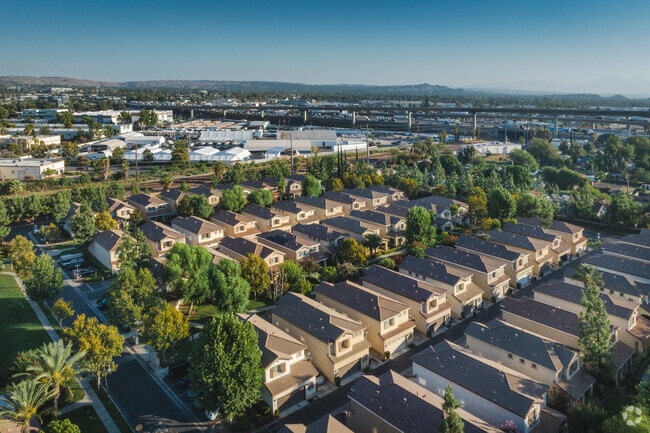
Contemporary homes fill the Hunter Industrial Park area.
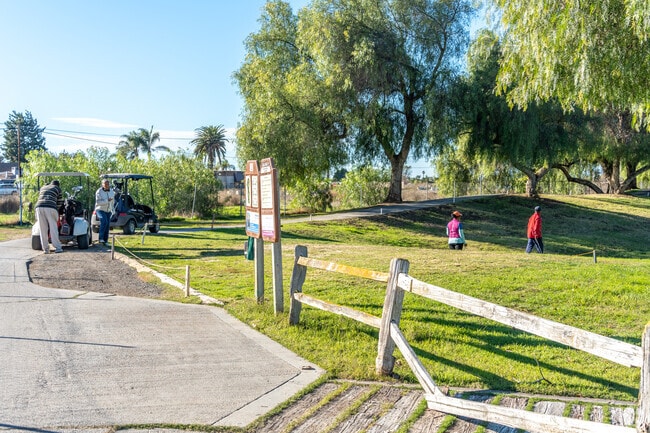
Van Buren Golf Center is a welcoming destination for enthusiasts in Riverside Airport.
University locals can enjoy burgers at The Barn on the UC Riverside campus.
The Citrus Festival celebrates the rich history of citrus in Riverside.
Mt. Rubidoux Park is a popular attraction that Casa Blanca residents can take a short drive to.
Median Household Income
$81,133
Average: $100,689
Education
64,446
Residents Have a Degree
Job Market
153,655
Workers Employed
Median Age
34 Years
Largest Age Group
25-34 Years
Approximately 17% of Residents
Under 20
26%
Over 65
12%
Housing Distribution
Riverside has more homeowners than renters.

Education Distribution
Review this city's overall education levels.

As of July 2026, the average apartment rent in Riverside, CA is $1,507 for a studio, $1,901 for one bedroom, $2,285 for two bedrooms, and $2,788 for three bedrooms. Apartment rent in Riverside has increased by 1.6% in the past year.
The cost of living in Riverside, CA is 16.1% higher than the national average. Generally, housing in Riverside is 31.2% more expensive than the national average, with rent falling between $1,507 - $2,794. You can expect to pay 15.8% more for groceries, 15.1% more for utilities, and 14.2% more for transportation.
Compare Cities
Explore how walkable, bikeable, drivable, and transit-friendly Riverside, CA is for everyday living.
Moderately Walkable
Walkability
Exceptional Public Transit
Transit
Exceptionally Drivable
Drivability
Fairly Bikeable
Bikeability
Public
Grades K-5
767 Students

Benjamin Franklin Elementary School
Public
Grades K-5
767 Students
Public
Grades K-12
665 Students
Lake Mathews Elementary School
Public
Grades K-5
733 Students

Public
Grades K-5
684 Students
Public
Grades K-12
665 Students
Frank Augustus Miller Middle School
Public
Grades 6-8
844 Students
Public
Grades 6-8
743 Students
Public
Grades 6-8
844 Students

Public
Grades 6-8
743 Students
Public
Grades K-12
665 Students
Martin Luther King Jr. High School
Public
Grades 9-12
2,699 Students
Public
Grades 9-12
2,699 Students
Public
Grades 9-12
1,780 Students
Public
Grades 9-12
1,780 Students
† Our analysis of utilities, groceries, transportation, healthcare, home prices, and other goods and services is sourced from the Cost of Living Index, a respected benchmark published by the Council for Community and Economic Research (C2ER) that provides a thorough overview of living expenses across different regions.
Rent data is provided by CoStar Group’s Market Trend reports. As the industry leader in commercial real estate information, analytics, and news, CoStar conducts extensive research to produce and maintain a comprehensive database of commercial real estate information. We combine this data with public record to provide the most up-to-date rental information available.
Consumer goods, services, and home prices are sourced from the Cost of Living Index published by the Council for Community and Economic Research (C2ER). The data on this page is updated quarterly. It was last published in June 2026.
Demographic information comes from Neustar and combines detailed address data with U.S. Census and American Community Survey statistics to produce reliable local estimates.


