
Raincross Promenade
3250 Market St,
Riverside, CA 92501
$2,415 - $3,645
1-3 Beds
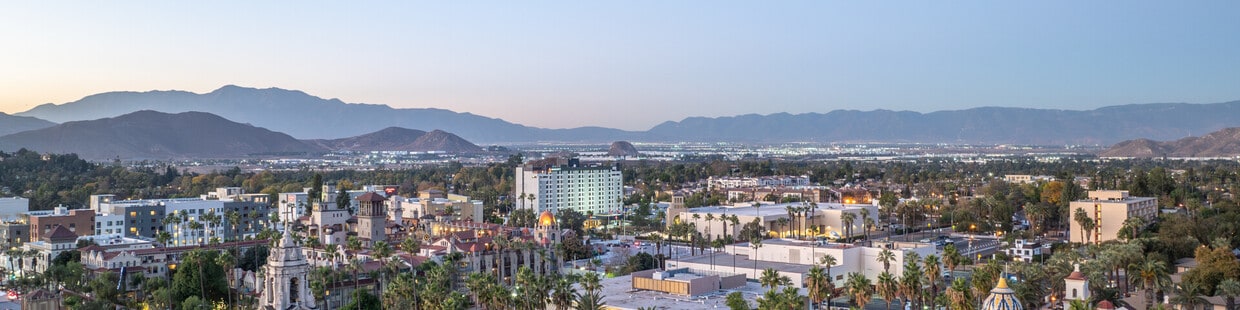


Located in Southern California's Inland Empire, Riverside combines historic architecture with contemporary living. As the birthplace of California's citrus industry, the city features landmarks like the iconic Mission Inn Hotel & Spa in downtown and the University of California, Riverside campus. Mount Rubidoux and numerous parks offer outdoor recreation throughout the city. Housing options include historic properties in the Wood Streets neighborhood and residential communities in Orange Crest and Alessandro Heights. Current rental rates range from $1,480 for studios to $2,632 for three-bedroom units.
Downtown Riverside features the restored Fox Performing Arts Center, which premiered "Gone with the Wind" in 1939. Victoria Avenue showcases the city's agricultural roots with historic citrus groves, while the California Citrus State Historic Park preserves this important heritage. The downtown pedestrian mall offers shopping and dining options, and the Mission Inn's Festival of Lights has become a Southern California holiday tradition. The city's historic Parent Washington Navel Orange Tree still stands as a testament to the region's agricultural influence. The downtown area features art galleries and performance venues, while parks and recreation areas dot the cityscape.
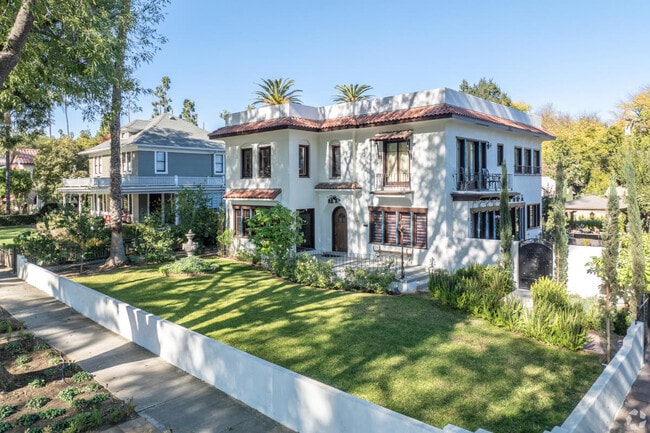
Riverside’s historic districts showcase timeless architecture and character.
The Citrus Festival celebrates the rich history of citrus in Riverside.
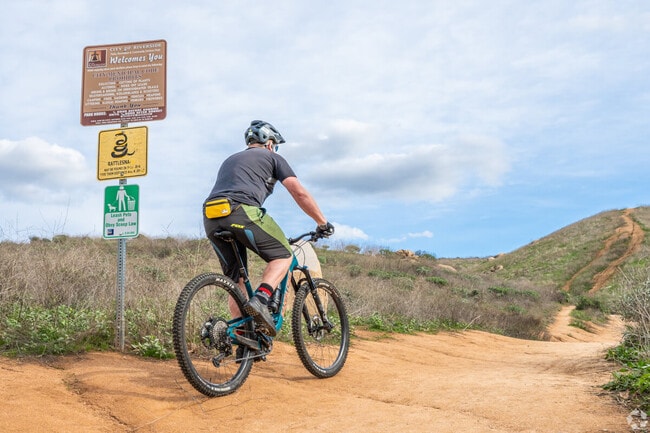
Riverside residents can enjoy a mountain bike ride at Sycamore Wilderness Park.
As of March 2026, the average apartment rent in Riverside, CA is $1,461 for a studio, $1,864 for one bedroom, $2,287 for two bedrooms, and $2,745 for three bedrooms. Apartment rent in Riverside has decreased by -1.0% in the past year.
The cost of living in Riverside, CA is 16.0% higher than the national average. Generally, housing in Riverside is 31.2% more expensive than the national average, with rent falling between $1,461 - $2,745. You can expect to pay 15.8% more for groceries, 13.7% more for utilities, and 14.2% more for transportation.
Explore how walkable, bikeable, drivable, and transit-friendly Riverside, CA is for everyday living.
Somewhat Walkable
You might be able to get out and walk when living in this area. Some errands can be accomplished on foot, but for others you’ll need a car.
Some Transit
You'll likely want a car when living in this area since it has few transit options.
Bikeable
While there’s some bike infrastructure in this area, you’ll still need a car for many errands.
Public
Grades K-5

Public
Grades K-12
Public
Grades K-5

Public
Grades K-5
Public
Grades K-5
Public
Grades K-12
Public
Grades K-12

Public
Grades 6-8
Public
Grades 6-8
Public
Grades 6-8

Public
Grades K-12
Public
Grades 9-12
Public
Grades K-12
Public
Grades 9-12
Public
Grades 9-12
97
Communities
15,085
Units
40
Cities

3,490
Communities
958,413
Units
893
Cities

24
Communities
1,597
Units
16
Cities

54
Communities
7,138
Units
22
Cities

64
Communities
11,802
Units
29
Cities

22
Communities
6,961
Units
14
Cities
† Our analysis of utilities, groceries, transportation, healthcare, home prices, and other goods and services is sourced from the Cost of Living Index, a respected benchmark published by the Council for Community and Economic Research (C2ER) that provides a thorough overview of living expenses across different regions.
Rent data is provided by CoStar Group’s Market Trend reports. As the industry leader in commercial real estate information, analytics, and news, CoStar conducts extensive research to produce and maintain a comprehensive database of commercial real estate information. We combine this data with public record to provide the most up-to-date rental information available.
Consumer goods, services, and home prices are sourced from the Cost of Living Index published by the Council for Community and Economic Research (C2ER). The data on this page is updated quarterly. It was last published in February 2026.


