Median Age
38 Years
Largest Age Group
25-34 Years
Approximately 14% of Residents
Under 20
25%
Over 65
18%
Avg Rent
$2,099
Population
74,173
Renter Mix
41% Rent
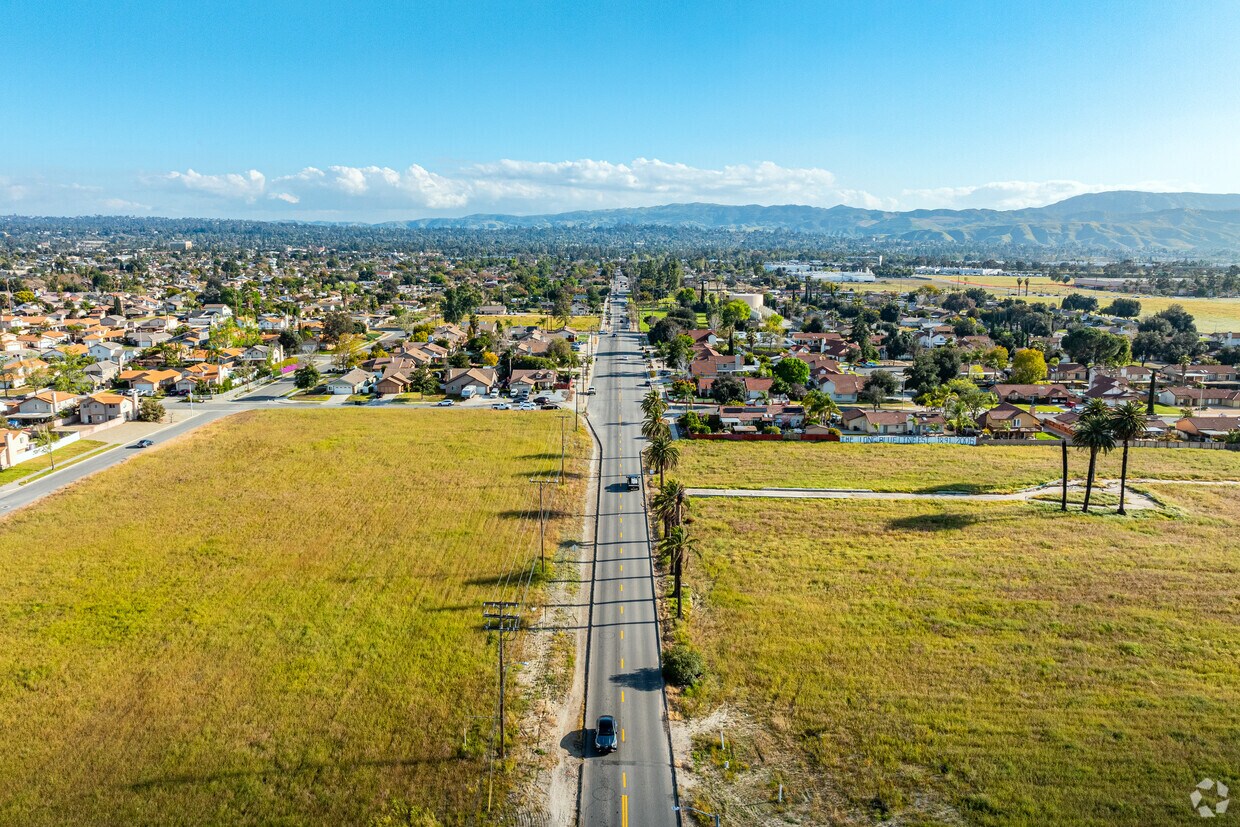
Where the mountains meet the desert on the edge of the Greater Los Angeles area, Redlands is a community that puts the rugged beauty of the Inland Empire right in your backyard. San Bernardino National Forest and Big Bear Lake sit just to the northeast, with Palm Springs, Joshua Tree National Park, and Coachella Valley within day trip distance.
Living in a Redlands apartment puts you just 15 minutes away from San Bernardino International Airport and Norton Air Force Base. Schools in the area score very highly, and both the University of Redlands and the University of California San Bernardino are close at hand.
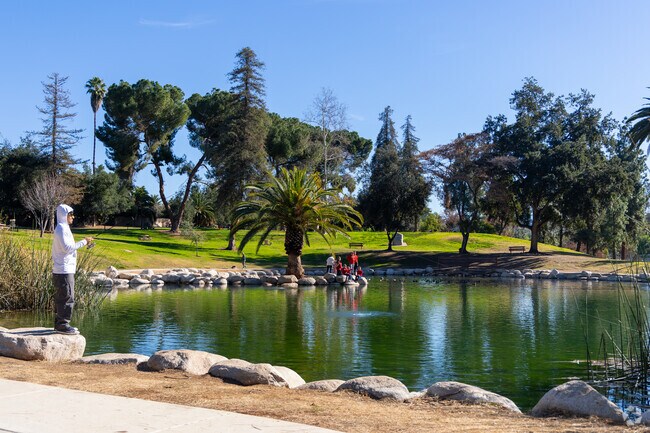
Fishing is one of the many activities to enjoy at Ford Park.
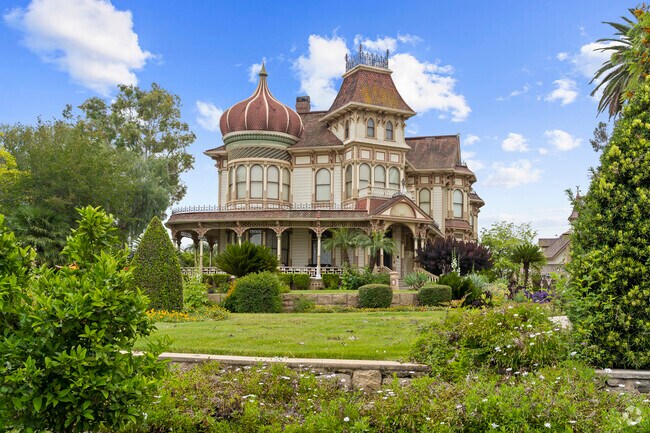
Step back in time with this unique historic house in Redlands, CA.
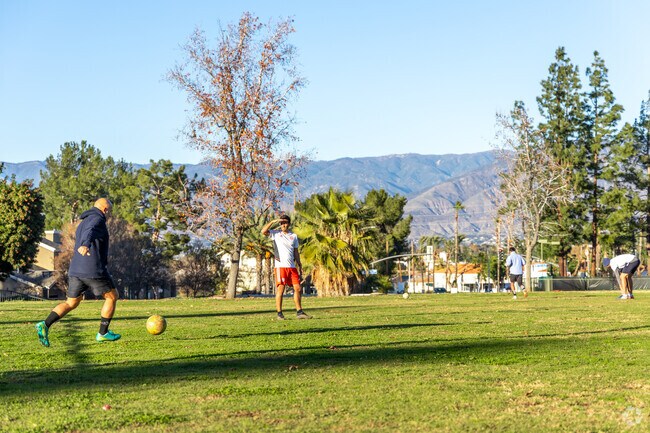
Enjoy the sports fields at Brookside Park.
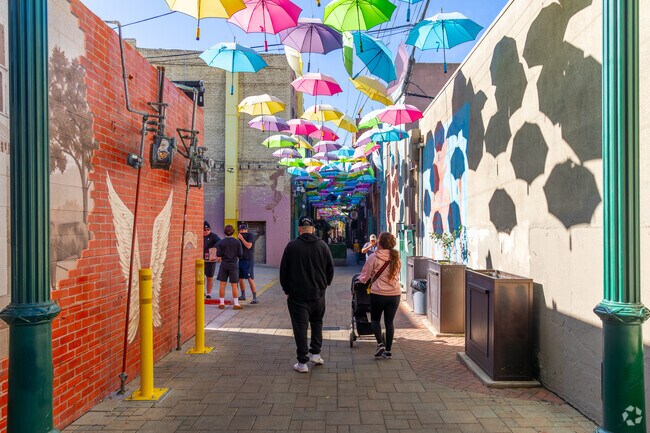
Explore unique art displays and interactive workshops at Redlands' Summer Arts Festival.
Cozy homes nestled in the heart of Redlands.
Scenic Lake Arrowhead is located 30 miles north of Redlands.
Median Household Income
$94,000
Average: $118,828
Education
25,231
Residents Have a Degree
Job Market
36,528
Workers Employed
Median Age
38 Years
Largest Age Group
25-34 Years
Approximately 14% of Residents
Under 20
25%
Over 65
18%
Housing Distribution
Redlands has more homeowners than renters.

Education Distribution
Review this city's overall education levels.

As of July 2026, the average apartment rent in Redlands, CA is $1,783 for a studio, $2,090 for one bedroom, $2,313 for two bedrooms, and $2,731 for three bedrooms. Apartment rent in Redlands has increased by 4.4% in the past year.
Explore how walkable, bikeable, drivable, and transit-friendly Redlands, CA is for everyday living.
Fairly Walkable
Walkability
Limited Public Transit
Transit
Very Drivable
Drivability
Somewhat Bikeable
Bikeability
Public
Grades K-5
315 Students

Public
Grades K-5
315 Students
Public
Grades K-5
457 Students

Public
Grades K-12
151 Students
Public
Grades K-5
694 Students

Public
Grades 6-12
262 Students
Public
Grades K-12
151 Students
Public
Grades 6-8
988 Students
Public
Grades 6-8
988 Students
Public
Grades 6-8
1,023 Students

Public
Grades 9-12
2,189 Students

Public
Grades 9-12
2,189 Students
Public
Grades 9-12
2,110 Students
Public
Grades 9-12
2,110 Students
Public
Grades 9-12
1,845 Students
† Our analysis of utilities, groceries, transportation, healthcare, home prices, and other goods and services is sourced from the Cost of Living Index, a respected benchmark published by the Council for Community and Economic Research (C2ER) that provides a thorough overview of living expenses across different regions.
Rent data is provided by CoStar Group’s Market Trend reports. As the industry leader in commercial real estate information, analytics, and news, CoStar conducts extensive research to produce and maintain a comprehensive database of commercial real estate information. We combine this data with public record to provide the most up-to-date rental information available.
Consumer goods, services, and home prices are sourced from the Cost of Living Index published by the Council for Community and Economic Research (C2ER). The data on this page is updated quarterly. It was last published in June 2026.
Demographic information comes from Neustar and combines detailed address data with U.S. Census and American Community Survey statistics to produce reliable local estimates.


