
The Dendry Townhomes
5548 N 250 W,
Provo, UT 84604
$2,350 - $4,341
2-4 Beds
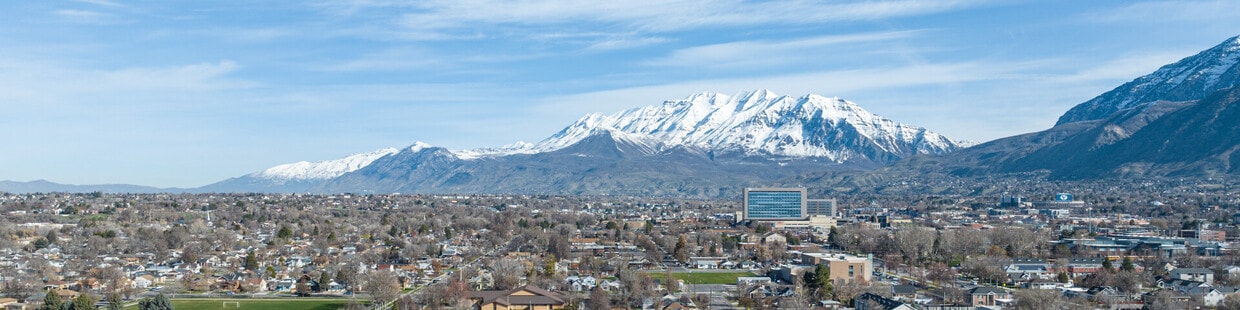

Nestled between Utah Lake and the Wasatch Mountains, Provo combines scenic beauty with a thriving community atmosphere. Home to Brigham Young University, this city of over 115,000 residents offers diverse neighborhoods and recreational opportunities. The rental market remains stable, with one-bedroom apartments averaging $1,198 monthly, showing a slight decrease of 0.2% over the past year.
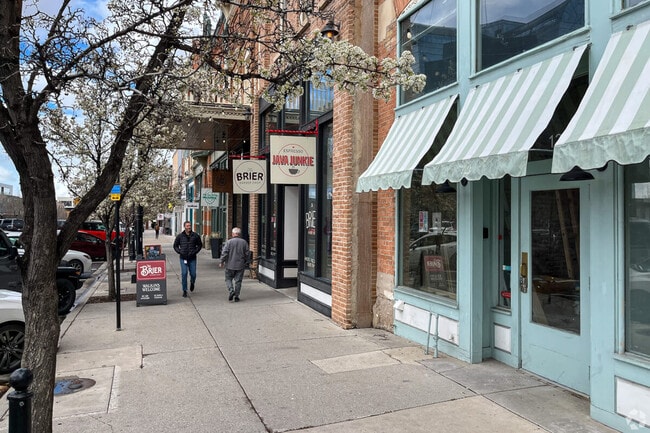
Downtown Provo features local shops and restaurants alongside landmarks like the restored Provo City Library at Academy Square. The Utah Valley Convention Center and Covey Center for the Arts host performances and events throughout the year. Community celebrations include the Freedom Festival and Festival Latinoamericano, bringing residents together for music, food, and cultural activities.
The city's location provides easy access to outdoor recreation, from hiking trails in Rock Canyon to water sports on Utah Lake. In winter, nearby ski resorts offer world-class slopes. The growing technology sector has brought new employment opportunities, while BYU's presence contributes to the city's educational resources. With its mountain views, cultural attractions, and convenient amenities, Provo offers residents a blend of outdoor adventure and city living.
There are many shopping options in the Downtown Provo neighborhood.
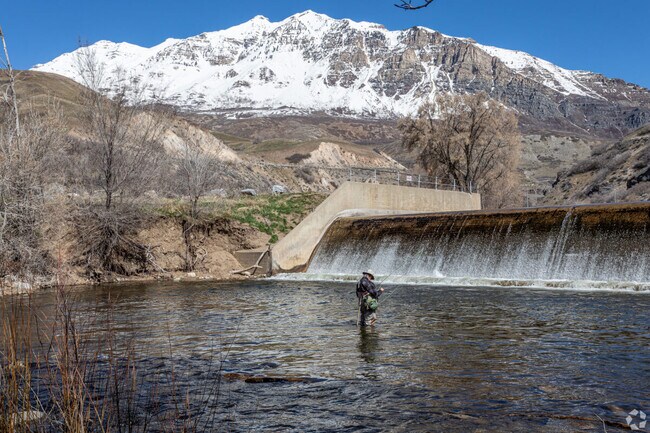
The Downtown Provo neighborhood offers easy access to fly fishing on the Provo River.
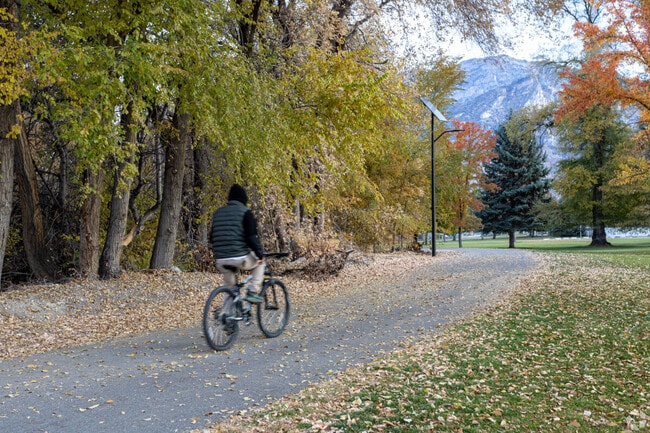
Exchange Park, located in the Rivergrove neighborhood, provides great bike trails.
As of March 2026, the average apartment rent in Provo, UT is $1,197 for a studio, $1,198 for one bedroom, $1,466 for two bedrooms, and $2,138 for three bedrooms. Apartment rent in Provo has decreased by -0.1% in the past year.
The cost of living in Provo, UT is 2.6% lower than the national average. Generally, housing in Provo is 3.5% more expensive than the national average, with rent falling between $1,197 - $2,138. You can expect to pay 4.0% less for groceries, 20.0% less for utilities, and 4.4% more for transportation.
Explore how walkable, bikeable, drivable, and transit-friendly Provo, UT is for everyday living.
Somewhat Walkable
You might be able to get out and walk when living in this area. Some errands can be accomplished on foot, but for others you’ll need a car.
Some Transit
You'll likely want a car when living in this area since it has few transit options.
Bikeable
While there’s some bike infrastructure in this area, you’ll still need a car for many errands.
Public
Grades K-5

Public
Grades K-5

Public
Grades K-5
Public
Grades K-12
Public
Grades K-5

Public
Grades K-12
Public
Grades K-12
2,433 Students

Public
Grades 6-8
Public
Grades 6-12

Public
Grades PK-12

Public
Grades 9-12
Public
Grades K-12
Public
Grades K-12
2,433 Students
Public
Grades 6-12
Public
Grades PK-12
51
Communities
7,387
Units
25
Cities

80
Communities
10,495
Units
39
Cities

26
Communities
3,734
Units
20
Cities

625
Communities
125,220
Units
245
Cities

559
Communities
125,432
Units
221
Cities
41
Communities
10,115
Units
28
Cities
† Our analysis of utilities, groceries, transportation, healthcare, home prices, and other goods and services is sourced from the Cost of Living Index, a respected benchmark published by the Council for Community and Economic Research (C2ER) that provides a thorough overview of living expenses across different regions.
Rent data is provided by CoStar Group’s Market Trend reports. As the industry leader in commercial real estate information, analytics, and news, CoStar conducts extensive research to produce and maintain a comprehensive database of commercial real estate information. We combine this data with public record to provide the most up-to-date rental information available.
Consumer goods, services, and home prices are sourced from the Cost of Living Index published by the Council for Community and Economic Research (C2ER). The data on this page is updated quarterly. It was last published in February 2026.


