Median Age
39 Years
Largest Age Group
30-39 Years
Approximately 16% of Residents
Under 20
24%
Over 65
16%
Avg Rent
$1,706
Population
73,727
Renter Mix
57% Rent
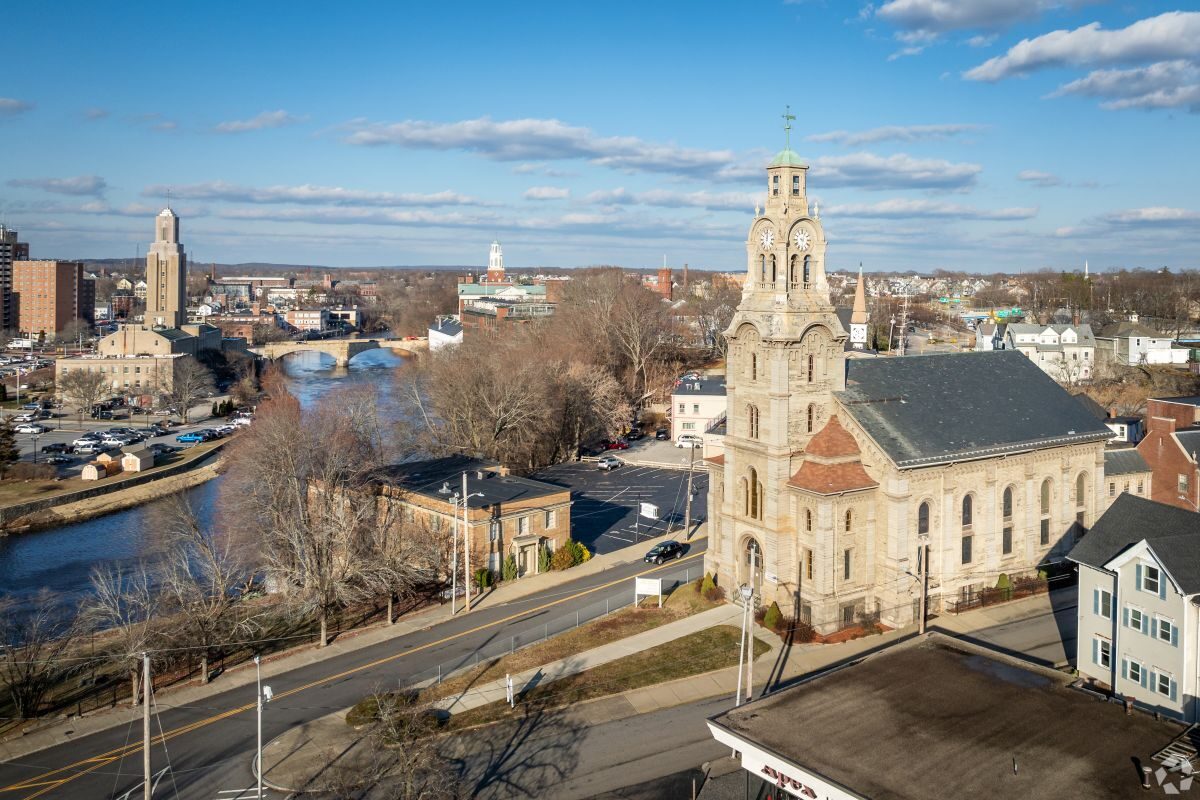
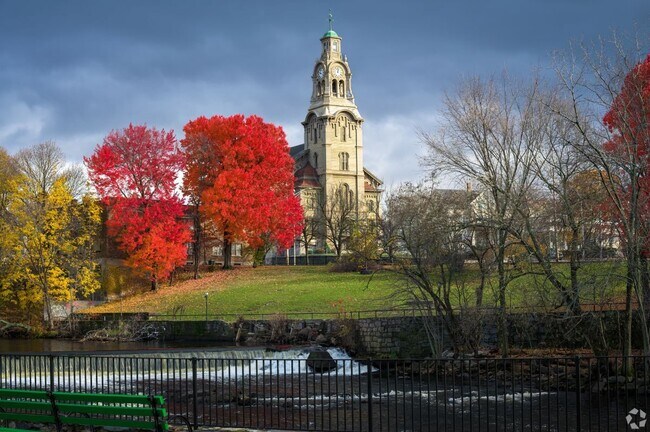
Located just five miles north of Providence, Pawtucket offers residents a blend of small-town charm and big-city amenities along the Rhode Island-Massachusetts border. Seekonk River – flowing into Providence River – travels directly through Pawtucket, offering scenic views from the city’s riverfront green spaces. Pawtucket fosters a strong sense of community with festive family-friendly events like the Pawtucket Arts Festival, Saint Patrick’s Day Parade, and Pawtucket’s Wonderland Spectacular.
This city is known for its sporting opportunities and events, with local mainstays like Pawtucket Red Sox games at McCoy Stadium, Slater Memorial Park, Seekonk River, and nearby Lincoln Woods State Park. Numerous historic attractions, performance venues, diverse eateries, and a burgeoning arts scene contribute to Pawtucket’s unique culture. Quick access to I-95 makes getting around from Pawtucket a breeze. Walkable streets, a welcoming community, and affordable apartments make this suburb highly sought-after for renters in the area.
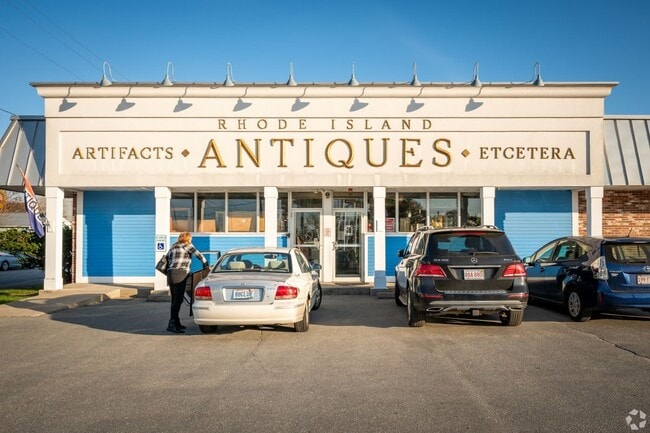
An antiques shop in Pawtucket
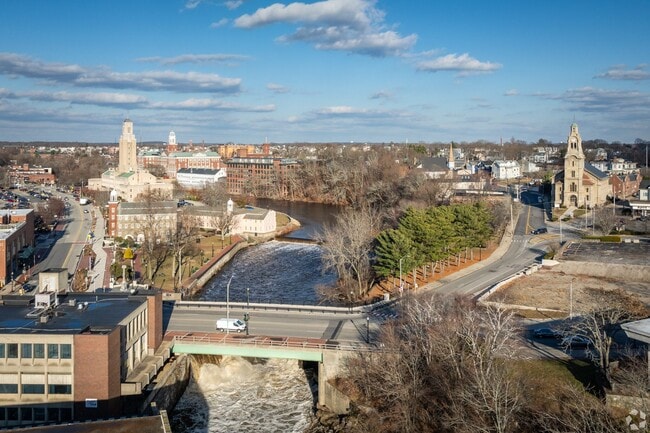
The Blackstone River runs through Downtown Pawtucket.
Median Household Income
$60,389
Average: $75,978
Education
15,754
Residents Have a Degree
Job Market
40,289
Workers Employed
Median Age
39 Years
Largest Age Group
30-39 Years
Approximately 16% of Residents
Under 20
24%
Over 65
16%
Housing Distribution
Pawtucket has more renters than homeowners.

Education Distribution
Review this city's overall education levels.

As of July 2026, the average apartment rent in Pawtucket, RI is $1,548 for a studio, $1,706 for one bedroom, $1,830 for two bedrooms, and $1,973 for three bedrooms. Apartment rent in Pawtucket has increased by 2.8% in the past year.
Explore how walkable, bikeable, drivable, and transit-friendly Pawtucket, RI is for everyday living.
Moderately Walkable
Walkability
Limited Public Transit
Transit
Exceptionally Drivable
Drivability
Fairly Bikeable
Bikeability
Public
Grades K-5
397 Students

Public
Grades K-5
361 Students
Public
Grades PK-5
253 Students
Public
Grades PK-5
557 Students

Public
Grades K-5
451 Students
Public
Grades 6-8
685 Students
Joseph Jenks Junior High School
Public
Grades 6-8
754 Students

Public
Grades 6-8
614 Students
Samuel Slater Junior High School
Public
Grades 6-8
673 Students

Public
Grades 9-12
177 Students

Public
Grades 9-12
361 Students

Public
Grades 9-12
1,122 Students
Public
Grades 9-12
1,122 Students
Public
Grades 9-12
869 Students
† Our analysis of utilities, groceries, transportation, healthcare, home prices, and other goods and services is sourced from the Cost of Living Index, a respected benchmark published by the Council for Community and Economic Research (C2ER) that provides a thorough overview of living expenses across different regions.
Rent data is provided by CoStar Group’s Market Trend reports. As the industry leader in commercial real estate information, analytics, and news, CoStar conducts extensive research to produce and maintain a comprehensive database of commercial real estate information. We combine this data with public record to provide the most up-to-date rental information available.
Consumer goods, services, and home prices are sourced from the Cost of Living Index published by the Council for Community and Economic Research (C2ER). The data on this page is updated quarterly. It was last published in June 2026.
Demographic information comes from Neustar and combines detailed address data with U.S. Census and American Community Survey statistics to produce reliable local estimates.


