
Trio Apartments
621 E Colorado Blvd,
Pasadena, CA 91101
$2,385 - $4,260 Total Monthly Price
Studio - 2 Beds


Located at the base of the San Gabriel Mountains, Pasadena sits 11 miles northeast of downtown Los Angeles. The city combines historic architecture with modern living, featuring preserved Craftsman bungalows and stately homes along Orange Grove Boulevard. Old Pasadena's walkable streets house local shops, restaurants, and landmarks like the Pasadena Playhouse. One-bedroom apartments rent for $2,385 per month, while two-bedroom units average $3,059.
Home to the California Institute of Technology (Caltech) and the Jet Propulsion Laboratory (JPL), Pasadena boasts significant cultural attractions including the Norton Simon Museum and USC Pacific Asia Museum. Residents enjoy access to hiking trails in the Arroyo Seco and can explore neighborhoods ranging from South Lake Avenue to the historic Bungalow Heaven district. The annual Tournament of Roses Parade, a tradition since 1890, draws visitors from around the world. The Rose Bowl and Brookside Park provide recreational spaces where residents can enjoy outdoor activities throughout the year.
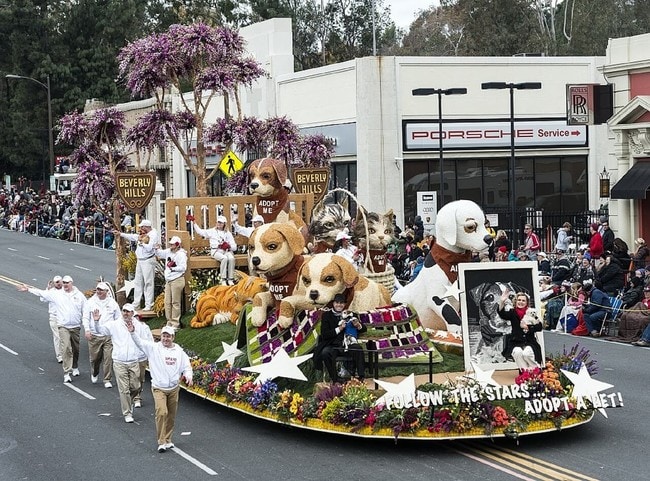
Pasadena is home to the world-famous Rose Bowl Parade
The Pasadena City Hall was completed in 1927
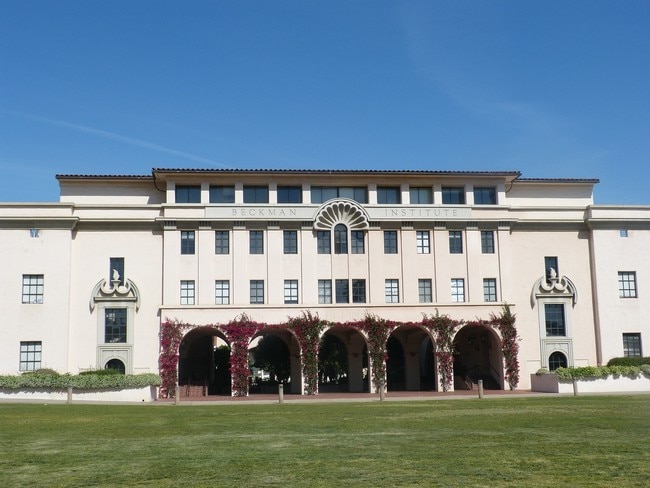
Pasadena is home to the prestigious Caltech
The Space Tech Expo at the Pasadena Convention Center
As of March 2026, the average apartment rent in Pasadena, CA is $1,957 for a studio, $2,342 for one bedroom, $3,030 for two bedrooms, and $3,770 for three bedrooms. Apartment rent in Pasadena has decreased by -2.3% in the past year.
Explore how walkable, bikeable, drivable, and transit-friendly Pasadena, CA is for everyday living.
Very Walkable
If you enjoy walking, you’ll enjoy renting in this area! It’s a very walkable neighborhood.
Good Transit
The area around this property has good transit with many nearby transportation options.
Very Bikeable
This area is very bikeable. You’ll find a variety of bike paths and lanes.
Public
Grades K-5

Public
Grades K-5
Public
Grades K-5

Public
Grades K-5
Public
Grades K-5
Public
Grades 6-12

Public
Grades 6-12

Octavia E. Butler Magnet School
Public
Grades 6-8

Public
Grades K-8

Public
Grades 6-8
386 Students

Public
Grades 9-12

Public
Grades 6-12
Public
Grades 9-12
Public
Grades 6-12
Rose City High (Continuation) School
Public
Grades 9-12

3,487
Communities
959,069
Units
894
Cities

142
Communities
9,839
Units
35
Cities

15
Communities
394
Units
10
Cities

715
Communities
198,674
Units
340
Cities

624
Communities
125,068
Units
245
Cities

159
Communities
26,767
Units
111
Cities
† Our analysis of utilities, groceries, transportation, healthcare, home prices, and other goods and services is sourced from the Cost of Living Index, a respected benchmark published by the Council for Community and Economic Research (C2ER) that provides a thorough overview of living expenses across different regions.
Rent data is provided by CoStar Group’s Market Trend reports. As the industry leader in commercial real estate information, analytics, and news, CoStar conducts extensive research to produce and maintain a comprehensive database of commercial real estate information. We combine this data with public record to provide the most up-to-date rental information available.
Consumer goods, services, and home prices are sourced from the Cost of Living Index published by the Council for Community and Economic Research (C2ER). The data on this page is updated quarterly. It was last published in February 2026.


