Median Age
47 Years
Largest Age Group
55-64 Years
Approximately 15% of Residents
Under 20
23%
Over 65
24%
Area Guide
Avg Rent
$1,522
Population
19,429
Renter Mix
13% Rent
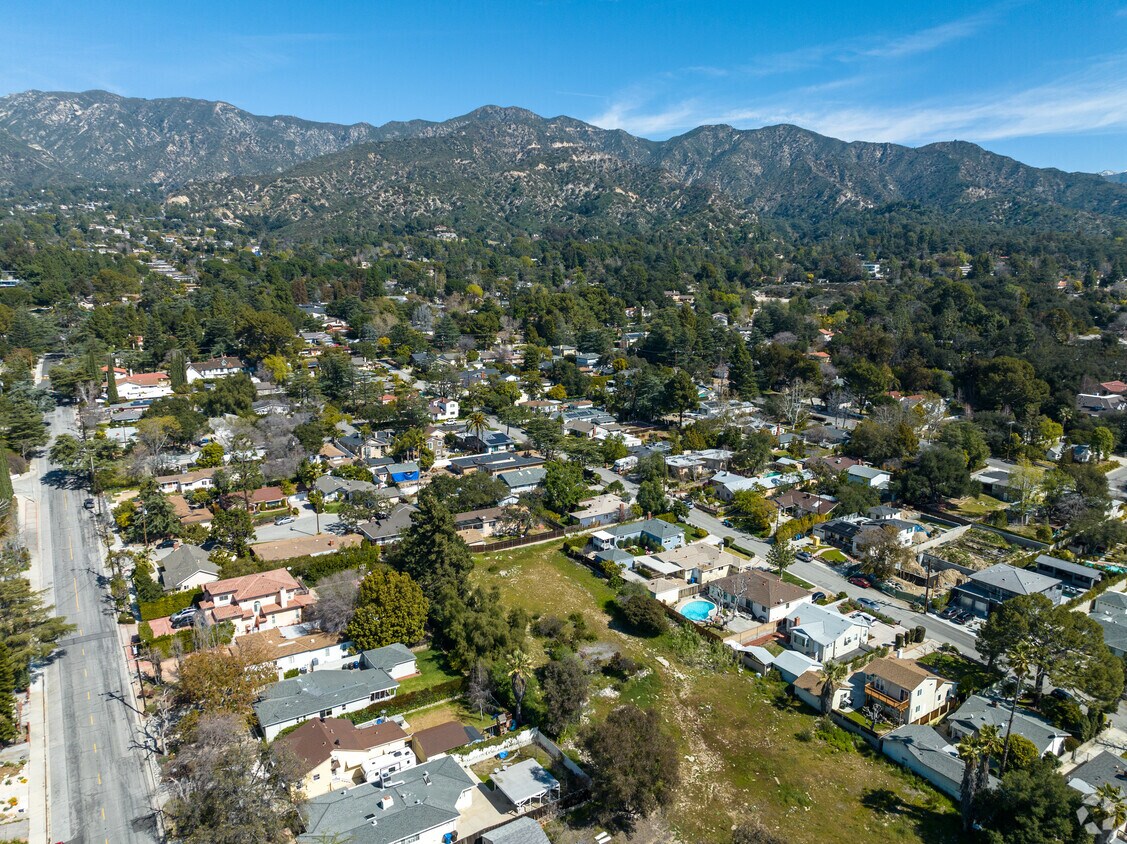
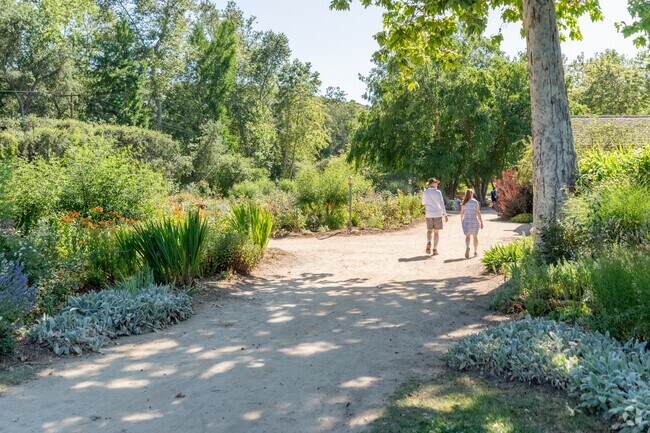
Tucked into the foothills of the Verdugo Mountains at the edge of Los Angeles County, La Canada Flintridge carries a quiet sense of purpose that sets it apart from most Southern California cities its size. Spanning just nine square miles, this small but well-established city sits in the Crescenta Valley between Glendale, Pasadena, and the Angeles National Forest, giving it easy access to metro Los Angeles without the density or noise that comes with it. Its most recognized institution is NASA's Jet Propulsion Laboratory, which anchors the city's identity around science, research, and innovation. Descanso Gardens, a 150-acre botanical garden open to the public year-round, adds a natural gathering point that feels genuinely local rather than touristy.
The housing stock here leans toward single-family homes, though renters will find apartment communities and smaller residential buildings scattered throughout. Many rentals are nestled into hillside settings with tree-lined streets and mountain views. The city incorporated in 1976, and much of its architectural character reflects mid-century and post-war California design. Glendale Community College and Art Center College of Design are both within a short drive, reinforcing the area's educational draw. Whether you're drawn by the proximity to major employment corridors or the foothill setting, La Canada Flintridge offers a grounded and well-connected place to call home.
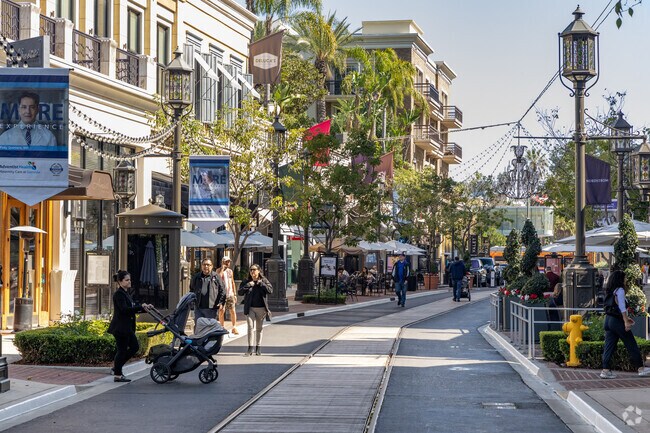
There is plenty to do at Americana on Brand near La Cañada Flintridge.
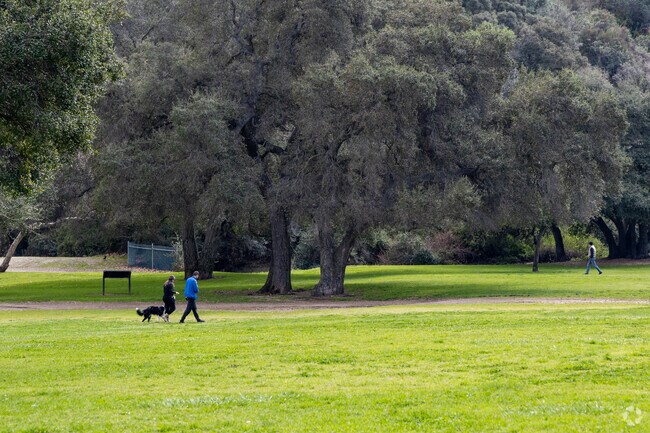
Take your dog for walk at the dog park in La Cañada Flintridge.
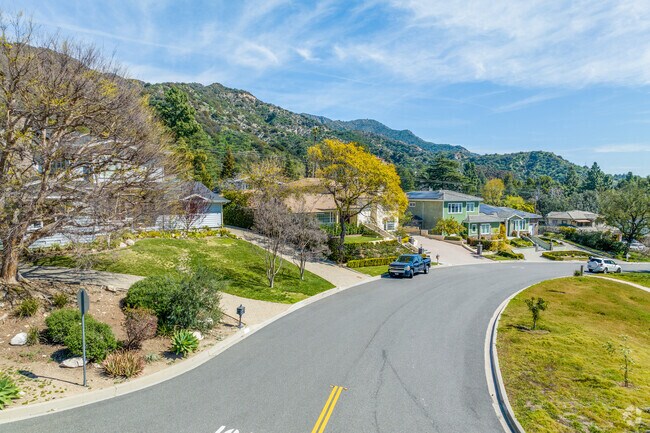
A beautiful La Cañada Flintridge street with foothills in the distance.
The local freeway gives you access to all surrounding cities from Pasadena to Hollywood.
NASA Jet Propulsion Laboratory is a research center in La Cañada Flintridge.
A plaza in La Cañada Flintridge is one of many shopping areas along Foothill Boulevard.
Median Household Income
$193,341
Average: $206,246
Education
10,366
Residents Have a Degree
Job Market
8,922
Workers Employed
Median Age
47 Years
Largest Age Group
55-64 Years
Approximately 15% of Residents
Under 20
23%
Over 65
24%
Housing Distribution
La Cañada Flintridge has more homeowners than renters.

Education Distribution
Review this city's overall education levels.

As of June 2026, the average apartment rent in La Cañada Flintridge, CA is $1,522 for one bedroom, $1,772 for two bedrooms, and $2,765 for three bedrooms. Apartment rent in La Cañada Flintridge has increased by 1.0% in the past year.
Explore how walkable, bikeable, drivable, and transit-friendly La Cañada Flintridge, CA is for everyday living.
Fairly Walkable
Walkability
Minimal Public Transit
Transit
Exceptionally Drivable
Drivability
Fairly Bikeable
Bikeability
Paradise Canyon Elementary School
Public
Grades K-5
715 Students

Public
Grades K-5
642 Students
Public
Grades K-5
642 Students
Public
Grades K-5
633 Students
Public
Grades K-5
633 Students
Public
Grades 6-12
1,989 Students

Public
Grades 6-12
1,989 Students
Public
Grades 6-12
1,989 Students
Public
Grades 6-12
1,989 Students
† Our analysis of utilities, groceries, transportation, healthcare, home prices, and other goods and services is sourced from the Cost of Living Index, a respected benchmark published by the Council for Community and Economic Research (C2ER) that provides a thorough overview of living expenses across different regions.
Rent data is provided by CoStar Group’s Market Trend reports. As the industry leader in commercial real estate information, analytics, and news, CoStar conducts extensive research to produce and maintain a comprehensive database of commercial real estate information. We combine this data with public record to provide the most up-to-date rental information available.
Consumer goods, services, and home prices are sourced from the Cost of Living Index published by the Council for Community and Economic Research (C2ER). The data on this page is updated quarterly. It was last published in June 2026.
Demographic information comes from Neustar and combines detailed address data with U.S. Census and American Community Survey statistics to produce reliable local estimates.


