Median Age
42 Years
Largest Age Group
35-44 Years
Approximately 16% of Residents
Under 20
21%
Over 65
20%


Avg Rent
$2,111
Population
23,632
Renter Mix
54% Rent
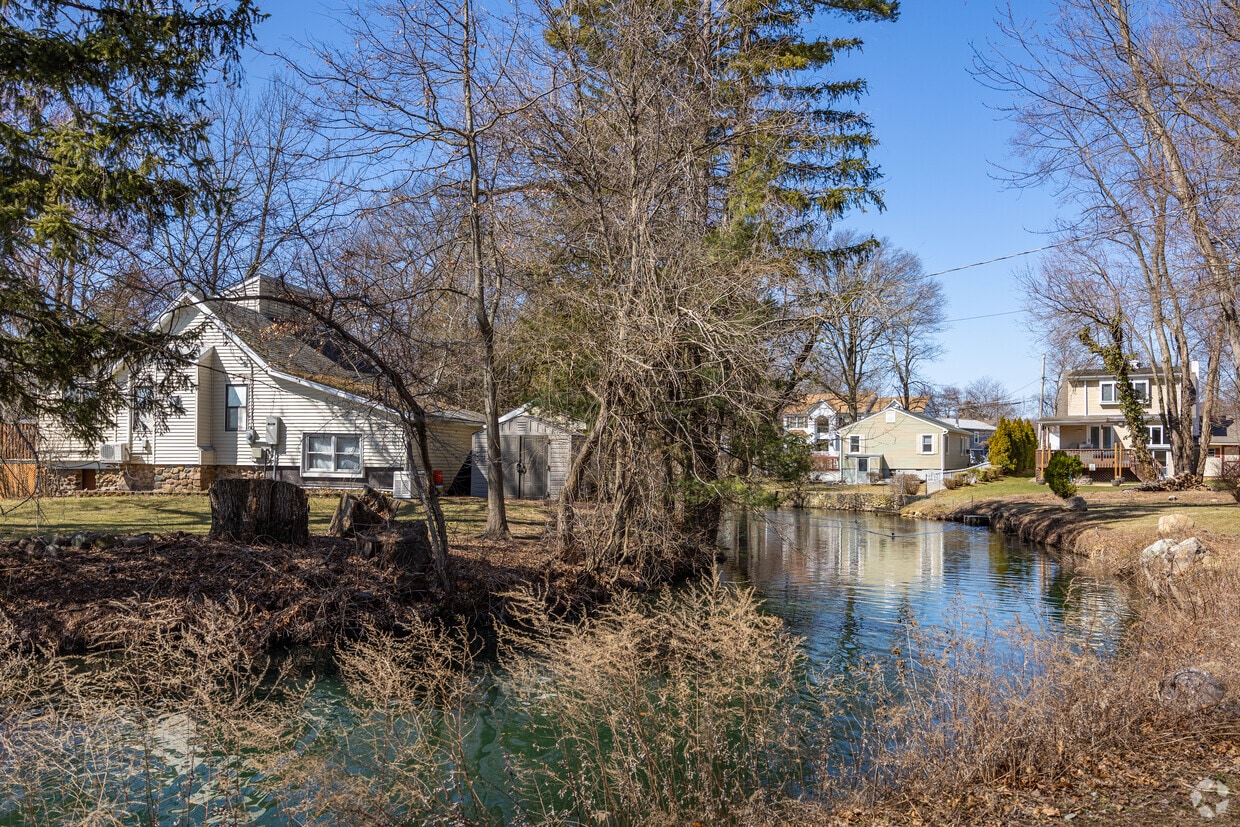
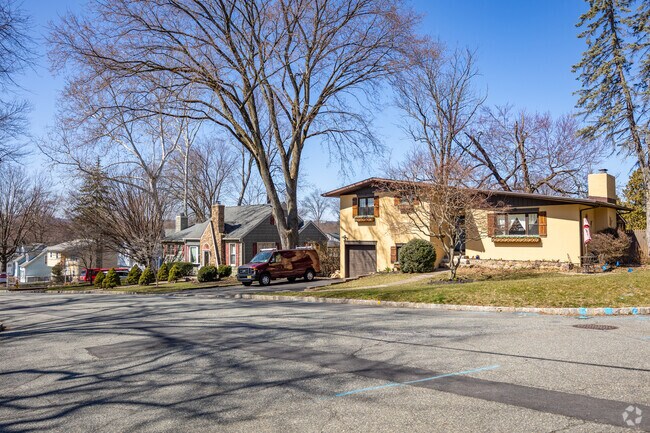
Located in Morris County, Parsippany-Troy Hills combines suburban comfort with easy access to metropolitan amenities. The township, recognized by Money magazine, offers housing options throughout established neighborhoods like Lake Hiawatha, Mount Tabor, and Lake Parsippany. One-bedroom apartments average $1,969, while two-bedroom units average $2,595. Positioned at the intersection of I-80, I-287, and I-280, Parsippany-Troy Hills provides convenient access to the New York metropolitan area.
The township spans 25 square miles, featuring Rainbow Lakes, Smith Field Park, and Veterans Memorial Park. The historic Mount Tabor district showcases preserved Victorian architecture, while the Lake Parsippany area offers waterfront recreation. The Parsippany-Troy Hills Township School District operates ten elementary schools and two high schools. Local landmarks include the BAPS Swaminarayan Mandir temple, reflecting the area's cultural heritage. The name "Parsippany" traces its origins to the Lenape people, meaning "the place where the river winds through the valley." While preserving its residential character, the township has developed into a significant business center, home to several major corporations.
Stop by and pick up a book at Barnes and Noble in Parsippany.
Wegman's has a large new location for residents in Parsippany.
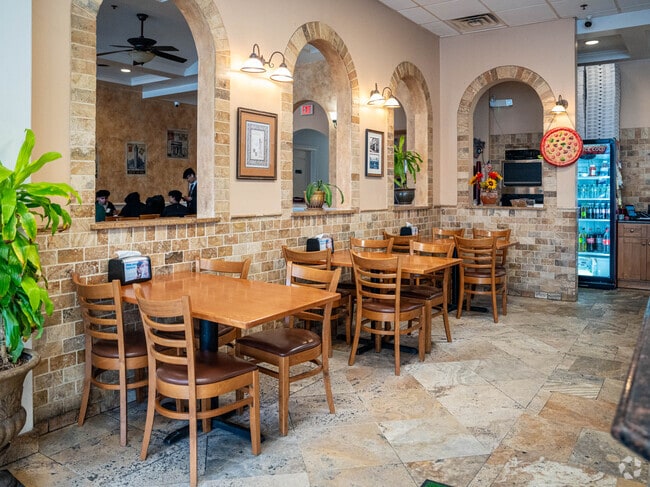
Stop by for some fresh baked pizza at Tabor Pizzeria.
Stop by home goods or other big box stores in Parsippany.
Tabor Pizzeria is a great spot to eat in or take out a hot pizza pie.
Median Household Income
$99,206
Average: $130,534
Education
11,702
Residents Have a Degree
Job Market
13,191
Workers Employed
Median Age
42 Years
Largest Age Group
35-44 Years
Approximately 16% of Residents
Under 20
21%
Over 65
20%
Housing Distribution
Parsippany has more renters than homeowners.

Education Distribution
Review this city's overall education levels.

As of July 2026, the average apartment rent in Parsippany, NJ is $2,358 for a studio, $2,111 for one bedroom, $2,783 for two bedrooms, and $4,375 for three bedrooms. Apartment rent in Parsippany has decreased by -0.2% in the past year.
Explore how walkable, bikeable, drivable, and transit-friendly Parsippany, NJ is for everyday living.
Somewhat Walkable
Walkability
Limited Public Transit
Transit
Exceptionally Drivable
Drivability
† Our analysis of utilities, groceries, transportation, healthcare, home prices, and other goods and services is sourced from the Cost of Living Index, a respected benchmark published by the Council for Community and Economic Research (C2ER) that provides a thorough overview of living expenses across different regions.
Rent data is provided by CoStar Group’s Market Trend reports. As the industry leader in commercial real estate information, analytics, and news, CoStar conducts extensive research to produce and maintain a comprehensive database of commercial real estate information. We combine this data with public record to provide the most up-to-date rental information available.
Consumer goods, services, and home prices are sourced from the Cost of Living Index published by the Council for Community and Economic Research (C2ER). The data on this page is updated quarterly. It was last published in June 2026.
Demographic information comes from Neustar and combines detailed address data with U.S. Census and American Community Survey statistics to produce reliable local estimates.


