Median Age
49 Years
Largest Age Group
55-64 Years
Approximately 15% of Residents
Under 20
20%
Over 65
27%

Avg Rent
$2,913
Population
10,840
Renter Mix
8% Rent
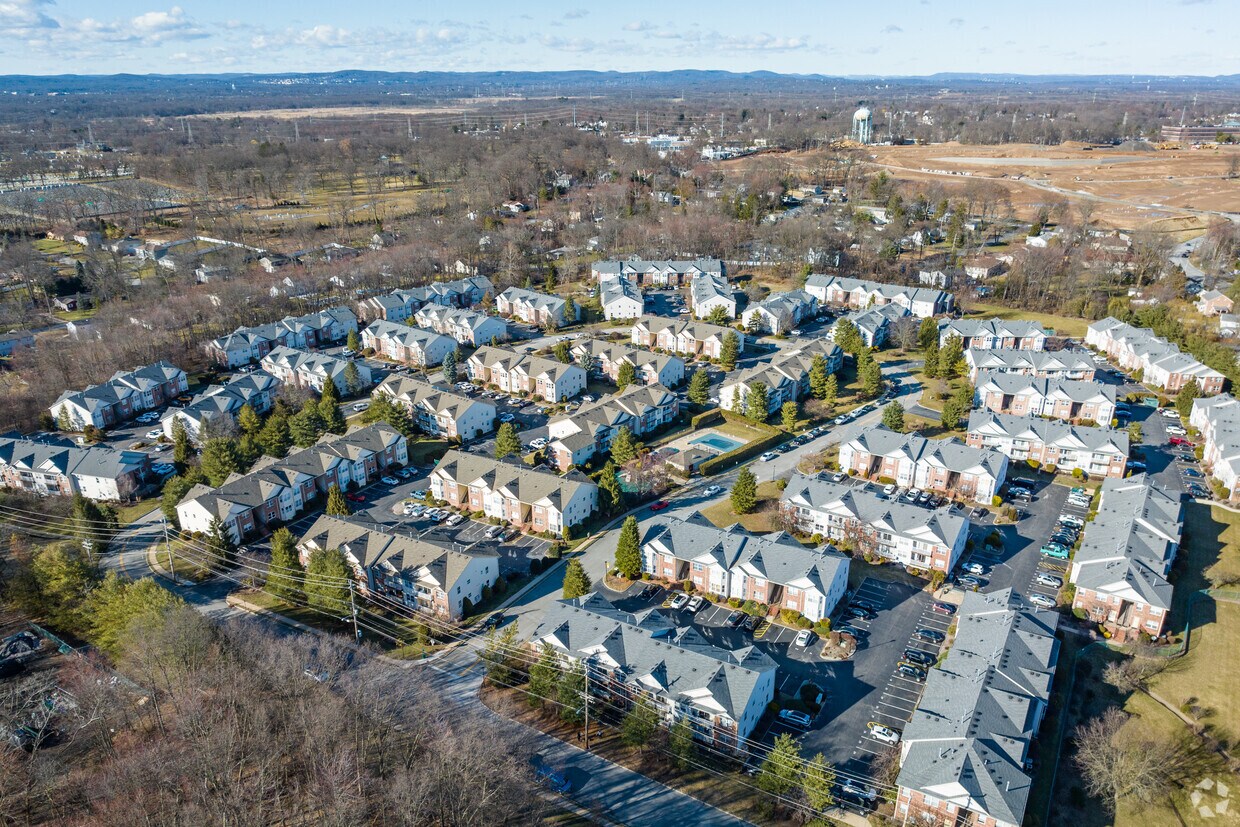
East Hanover’s community raves about its safe residential neighborhoods, community events, and family-friendly atmosphere. Located in the suburbs of northeast New Jersey, East Hanover provides modern day conveniences, including major department stores like Target and Home Depot, along with a variety of local and chain dining options. Hanover Commons and the surrounding commercial area provides a selection of both, along with entertainment options at an AMC Theater or the local amusement center, Funplex!
Small businesses keep this city charming, and Sorrento Bakery is one of the locals’ favorites for delicious desserts. With good public schools and spacious community parks, this suburb has more than enough family-friendly qualities. Commuters can easily travel into Newark and New York City from East Hanover, either by car or public transit. On the way, check out various attractions like Thomas Edison National Historic Park in West Orange.
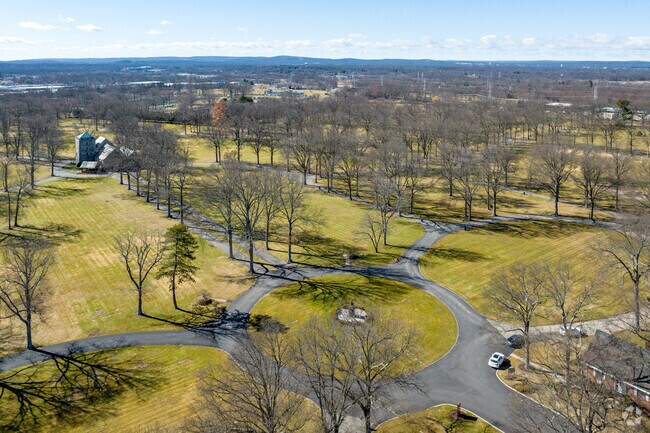
Restland Memorial Park in East Hanover, NJ.
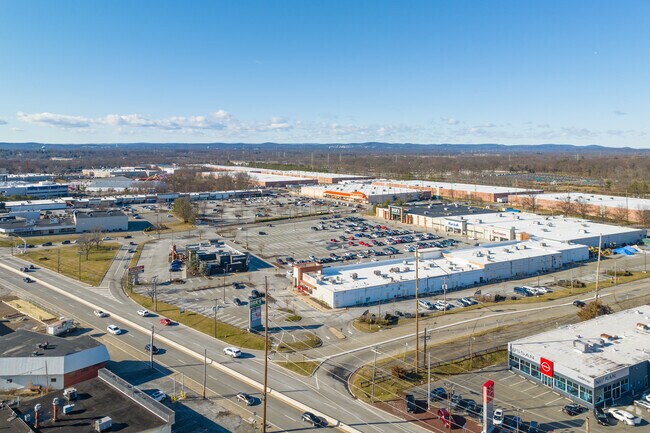
Retail shopping center in East Hanover.
Take a break from bowling to hit the bar at Hanover Lanes in East Hanover.
Residents can make use of the large rock walls at Diamond Rock Gym in East Hanover.
Residents can get their grocery shopping done at Trader Joe's in Denville.
The Godfather Brick Oven Pizzeria & Seafood Bar & Grill is a favorite of East Hanover residents.
Median Household Income
$130,638
Average: $160,155
Education
4,454
Residents Have a Degree
Job Market
5,827
Workers Employed
Median Age
49 Years
Largest Age Group
55-64 Years
Approximately 15% of Residents
Under 20
20%
Over 65
27%
Housing Distribution
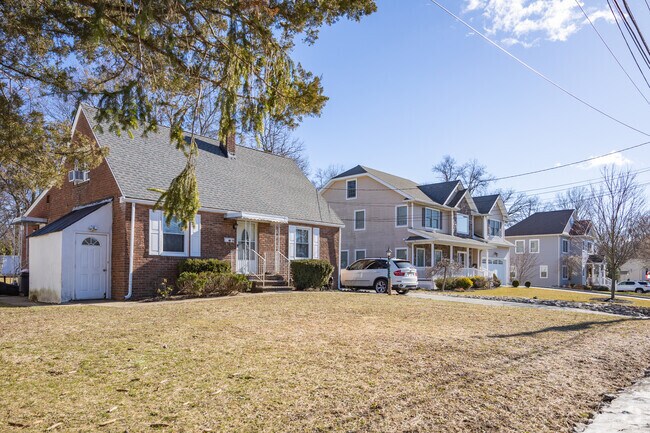
East Hanover has more homeowners than renters.

Education Distribution
Review this city's overall education levels.

As of July 2026, the average apartment rent in East Hanover, NJ is $2,912 for one bedroom, $3,737 for two bedrooms, and $4,679 for three bedrooms. Apartment rent in East Hanover has decreased by -2.6% in the past year.
Explore how walkable, bikeable, drivable, and transit-friendly East Hanover, NJ is for everyday living.
Somewhat Walkable
Walkability
Exceptionally Drivable
Drivability
Fairly Bikeable
Bikeability
Public
Grades K-5
439 Students

Frank J. Smith Elementary School
Public
Grades PK-5
239 Students

Public
Grades 6-8
297 Students
Public
Grades 9-12
731 Students
† Our analysis of utilities, groceries, transportation, healthcare, home prices, and other goods and services is sourced from the Cost of Living Index, a respected benchmark published by the Council for Community and Economic Research (C2ER) that provides a thorough overview of living expenses across different regions.
Rent data is provided by CoStar Group’s Market Trend reports. As the industry leader in commercial real estate information, analytics, and news, CoStar conducts extensive research to produce and maintain a comprehensive database of commercial real estate information. We combine this data with public record to provide the most up-to-date rental information available.
Consumer goods, services, and home prices are sourced from the Cost of Living Index published by the Council for Community and Economic Research (C2ER). The data on this page is updated quarterly. It was last published in June 2026.
Demographic information comes from Neustar and combines detailed address data with U.S. Census and American Community Survey statistics to produce reliable local estimates.


