
Sevens
777 W Middlefield Rd,
Mountain View, CA 94043
$3,733 - $7,121 Total Monthly Price
Studio - 2 Beds
Living in Palo Alto places you in Silicon Valley, where historic neighborhoods complement the city's technological presence. Tree-lined streets wind through the community, which is anchored by Stanford University. University Avenue features local boutiques and restaurants housed in preserved historic buildings, while the Stanford Shopping Center offers high-end retail destinations. The city maintains 36 parks and preserves, including the Baylands Nature Preserve and Foothills Park, where residents enjoy hiking trails and outdoor activities. Palo Alto's infrastructure supports alternative transportation, with dedicated bike lanes throughout the city.
The rental market in Palo Alto reflects the area's popularity, with current average rents ranging from $2,634 for studios to $6,139 for four-bedroom homes. Recent trends show steady growth, with rent increases varying from 1.8% to 17% across different unit sizes over the past year. Housing options include historic properties in Professorville, apartments near California Avenue, and residential communities in College Terrace. Downtown North offers proximity to University Avenue's shops and dining, while Midtown features local shopping centers and tree-lined streets. The city maintains strict building codes and zoning laws to preserve its architectural heritage while accommodating new development.
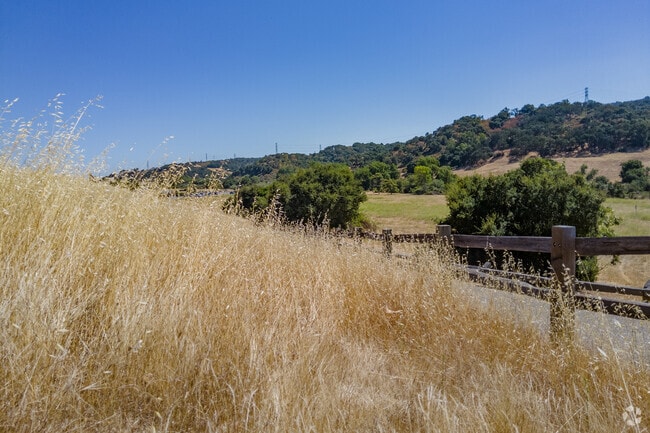
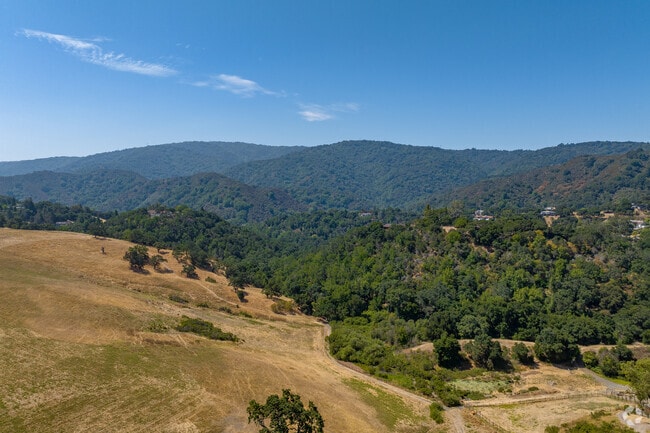
The Los Altos Hills are large and feature the natural beauty of the area.
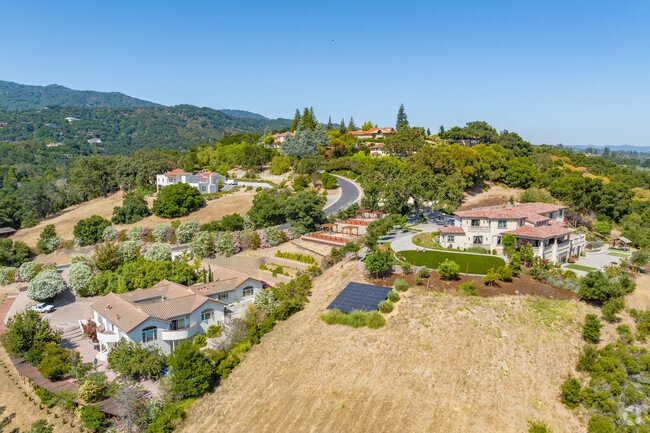
There are many home types spread throughout the Los Altos Hills.
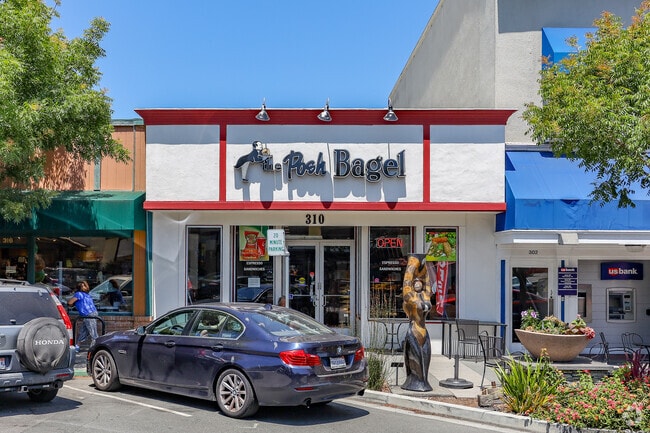
The Posh Bagel offers the most delicious bagels to Los Altos Hills residents.
Majestic wildlife can be found throughout the Los Altos Hills.
Downtown Los Altos offers many shopping and dining options.
The town of Los Altos is filled with spacious lots surrounded by beautiful scenery.
As of March 2026, the average apartment rent in Palo Alto, CA is $2,952 for a studio, $3,013 for one bedroom, $3,840 for two bedrooms, and $4,894 for three bedrooms. Apartment rent in Palo Alto has increased by 3.0% in the past year.
Explore how walkable, bikeable, drivable, and transit-friendly Palo Alto, CA is for everyday living.
Very Walkable
If you enjoy walking, you’ll enjoy renting in this area! It’s a very walkable neighborhood.
Some Transit
You'll likely want a car when living in this area since it has few transit options.
Biker's Paradise
Do you prefer to get around on two wheels? You’ll love living in this neighborhood, which is considered a biker’s paradise.
Public
Grades K-5

Public
Grades K-5
Public
Grades K-5
Public
Grades K-5

Public
Grades K-5
Public
Grades 6-8
Public
Grades 6-8
Public
Grades 6-8

Public
Grades 9-12
Public
Grades 9-12

43
Communities
2,835
Units
15
Cities

3,490
Communities
959,763
Units
894
Cities

36
Communities
11,007
Units
11
Cities

90
Communities
7,892
Units
33
Cities

170
Communities
58,994
Units
85
Cities

65
Communities
10,469
Units
32
Cities
† Our analysis of utilities, groceries, transportation, healthcare, home prices, and other goods and services is sourced from the Cost of Living Index, a respected benchmark published by the Council for Community and Economic Research (C2ER) that provides a thorough overview of living expenses across different regions.
Rent data is provided by CoStar Group’s Market Trend reports. As the industry leader in commercial real estate information, analytics, and news, CoStar conducts extensive research to produce and maintain a comprehensive database of commercial real estate information. We combine this data with public record to provide the most up-to-date rental information available.
Consumer goods, services, and home prices are sourced from the Cost of Living Index published by the Council for Community and Economic Research (C2ER). The data on this page is updated quarterly. It was last published in February 2026.


