Median Age
49 Years
Largest Age Group
15-24 Years
Approximately 17% of Residents
Under 20
20%
Over 65
29%
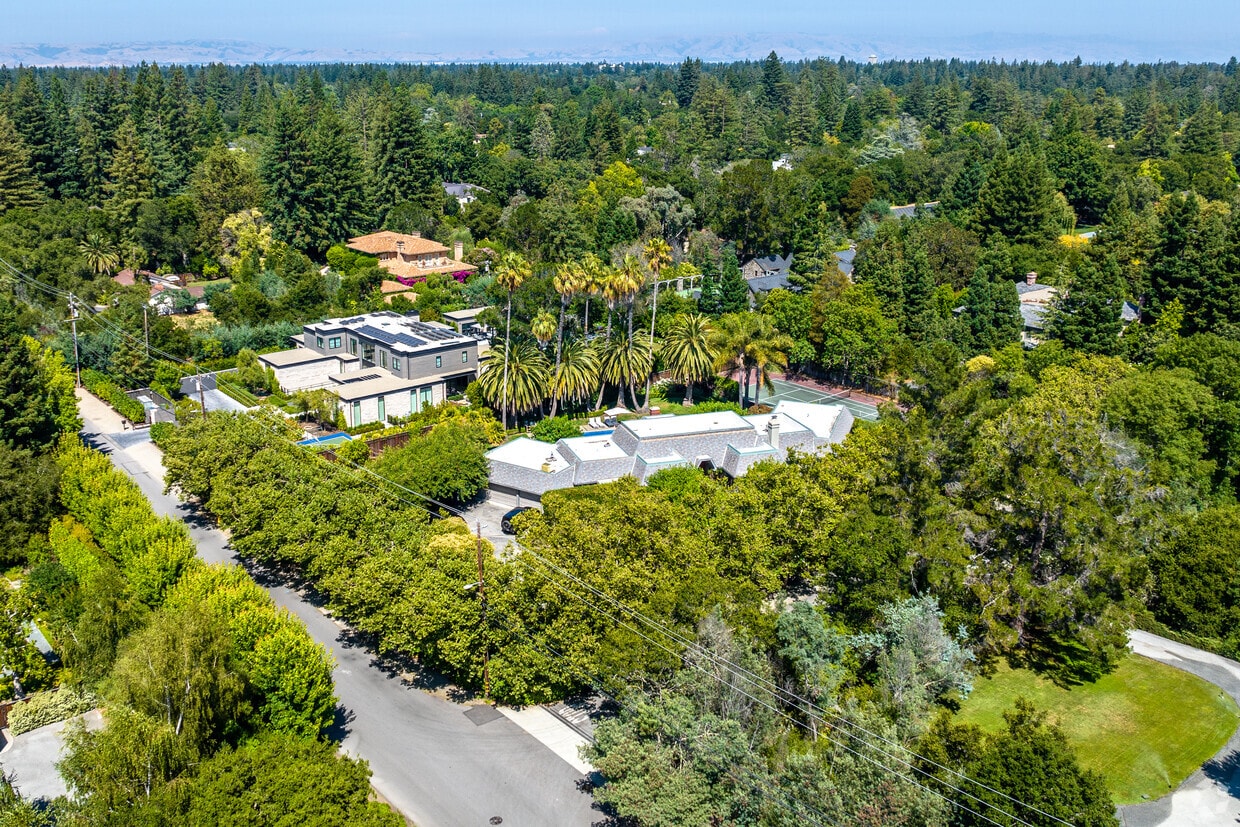

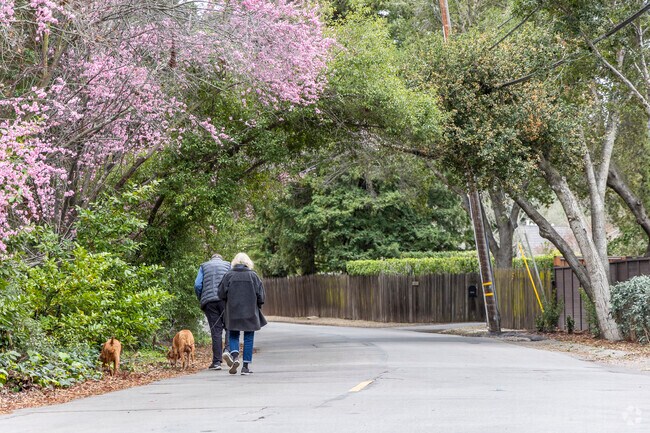

Atherton is a wooded San Mateo County town the landscape feel more like a natural retreat than a Silicon Valley address. Tree-lined streets canopied by old oaks sit next to modern buildings, defining the look and feel of daily life here. The town is almost entirely residential, so most errands, dining, and entertainment draw residents to neighboring Menlo Park and Redwood City, both just minutes away. Menlo College, a liberal arts institution with a focus on business, sits less than a mile from town, and Stanford University is a 13-minute drive to the south.
Atherton streets are typically tree lined and full of natural beauty.
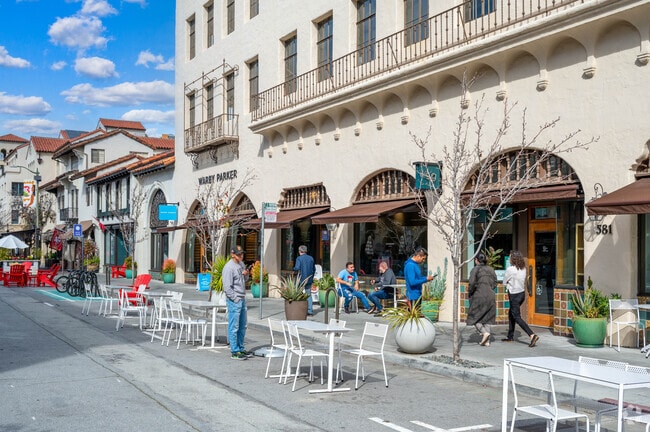
Downtown Palo Alto has plenty of dining options for Atherton residents.
The outdoor patio at Left Bank is a popular spot for Atherton residents.
Menlo College in Atherton is a small, private, non-profit Silicon Valley school.
Atherton locals love to dine outside on a beautiful day in Downtown Palo Alto.
There is a commuter rail line that runs through Atherton and Menlo Park.
Median Household Income
$247,781
Average: $239,096
Education
4,381
Residents Have a Degree
Job Market
3,009
Workers Employed
Median Age
49 Years
Largest Age Group
15-24 Years
Approximately 17% of Residents
Under 20
20%
Over 65
29%
Housing Distribution
Atherton has more homeowners than renters.

Education Distribution
Review this city's overall education levels.

Explore how walkable, bikeable, drivable, and transit-friendly Atherton, CA is for everyday living.
Fairly Walkable
Walkability
Limited Public Transit
Transit
Very Drivable
Drivability
Fairly Bikeable
Bikeability

Public
Grades K-5
658 Students

Public
Grades K-5
658 Students
Public
Grades K-5
522 Students
Public
Grades K-5
604 Students

Adelante Selby Spanish Immersion
Public
Grades K-5
582 Students

Public
Grades 9-12
2,158 Students

 The GreatSchools Rating helps parents compare schools within a state based on a variety of school quality indicators and provides a helpful picture of how effectively each school serves all of its students. Ratings are on a scale of 1 (below average) to 10 (above average) and can include test scores, college readiness, academic progress, advanced courses, equity, discipline and attendance data. We also advise parents to visit schools, consider other information on school performance and programs, and consider family needs as part of the school selection process.
View GreatSchools Rating Methodology
Data provided by
GreatSchools.org
© 2026. All rights reserved.
The GreatSchools Rating helps parents compare schools within a state based on a variety of school quality indicators and provides a helpful picture of how effectively each school serves all of its students. Ratings are on a scale of 1 (below average) to 10 (above average) and can include test scores, college readiness, academic progress, advanced courses, equity, discipline and attendance data. We also advise parents to visit schools, consider other information on school performance and programs, and consider family needs as part of the school selection process.
View GreatSchools Rating Methodology
Data provided by
GreatSchools.org
© 2026. All rights reserved.
† Our analysis of utilities, groceries, transportation, healthcare, home prices, and other goods and services is sourced from the Cost of Living Index, a respected benchmark published by the Council for Community and Economic Research (C2ER) that provides a thorough overview of living expenses across different regions.
Rent data is provided by CoStar Group’s Market Trend reports. As the industry leader in commercial real estate information, analytics, and news, CoStar conducts extensive research to produce and maintain a comprehensive database of commercial real estate information. We combine this data with public record to provide the most up-to-date rental information available.
Consumer goods, services, and home prices are sourced from the Cost of Living Index published by the Council for Community and Economic Research (C2ER). The data on this page is updated quarterly. It was last published in September 2026.
Demographic information comes from Neustar and combines detailed address data with U.S. Census and American Community Survey statistics to produce reliable local estimates.