
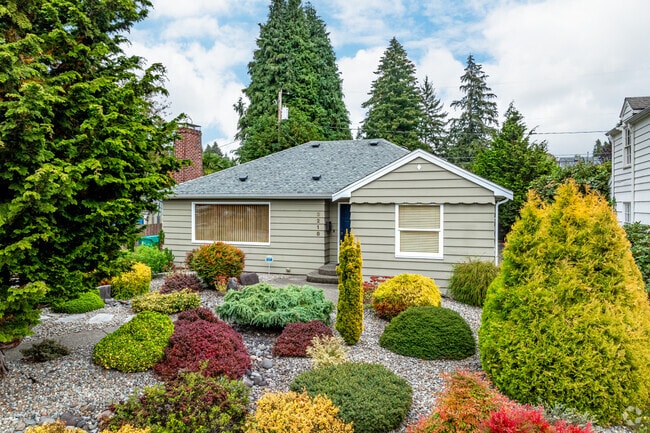
401 Union
401 Union Ave SE,
Olympia, WA 98501
$1,400 - $2,300
Studio - 2 Beds
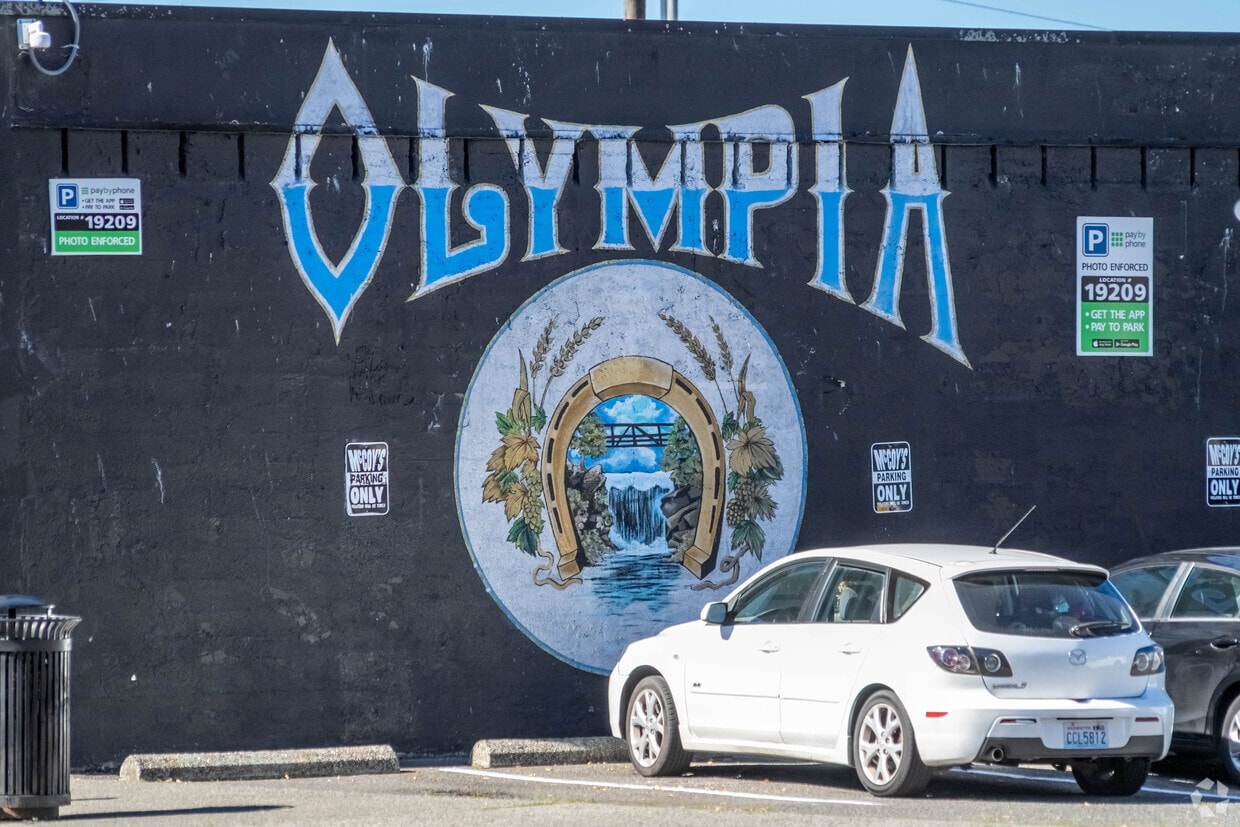
Nestled at the southern tip of Puget Sound, Olympia combines waterfront scenery with the distinction of being Washington's capital city. From historic downtown apartments to residential communities in East Olympia and South Capitol, the housing options are extensive. The rental market remains stable, with current average rents ranging from $1,308 for studios to $2,378 for four-bedroom homes, showing modest year-over-year increases between 0.7% and 2.1%. The city features an extensive trail system, including Squaxin Park (formerly Priest Point Park) with its 150-year-old forest and waterfront access, while downtown hosts the historic Capitol Theater and Washington Center for Performing Arts.
Downtown Olympia centers around Percival Landing, where the year-round Olympia Farmers Market draws visitors to the waterfront boardwalk. The Evergreen State College and South Puget Sound Community College contribute to the city's educational landscape. The South Capitol Historic District features preserved craftsman homes, while the West Side offers residential communities near parks and natural areas. Downtown's artesian wells, including the historic Fourth Avenue Fountain, remain an integral part of local heritage. The annual Procession of the Species parade, held each April, showcases the community's artistic spirit through elaborate costumes and performances.
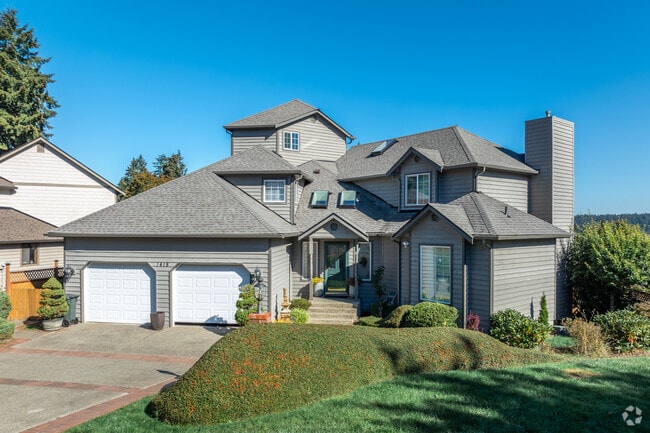
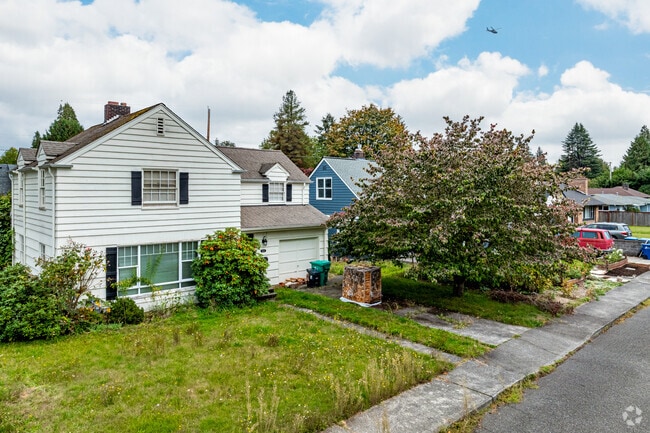
Rows of large homes for growing families can be found in Northwest.
Carlyon-North offers charming homes with easy access to Washington’s top attractions.
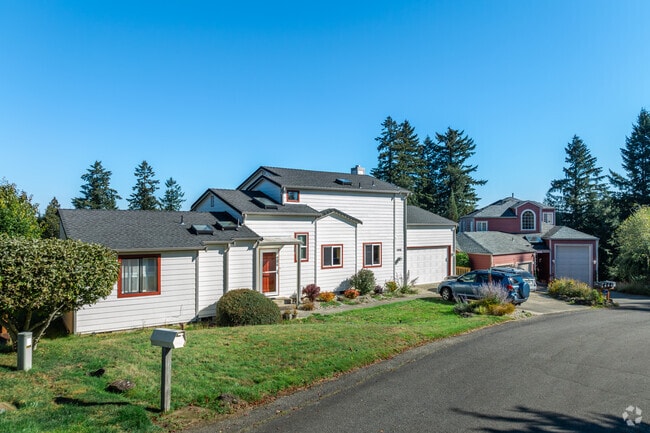
Cozy homes in Carlyon-North, close to parks, schools, and local amenities.
Travel made easy with SeaTac International Airport near Carlyon-North.
As of March 2026, the average apartment rent in Olympia, WA is $1,246 for a studio, $1,510 for one bedroom, $1,833 for two bedrooms, and $2,121 for three bedrooms. Apartment rent in Olympia has increased by 1.2% in the past year.
The cost of living in Olympia, WA is 13.2% higher than the national average. Generally, housing in Olympia is 17.3% more expensive than the national average, with rent falling between $1,246 - $2,121. You can expect to pay 6.2% more for groceries, 2.6% less for utilities, and 28.4% more for transportation.
Explore how walkable, bikeable, drivable, and transit-friendly Olympia, WA is for everyday living.
Somewhat Walkable
You might be able to get out and walk when living in this area. Some errands can be accomplished on foot, but for others you’ll need a car.
Some Transit
You'll likely want a car when living in this area since it has few transit options.
Bikeable
While there’s some bike infrastructure in this area, you’ll still need a car for many errands.
Public
Grades PK-5

Public
Grades K-5

Public
Grades K-5

Public
Grades PK-5
Public
Grades K-5
Public
Grades 6-8
Public
Grades 6-8
Thurgood Marshall Middle School
Public
Grades 6-8
Public
Grades 6-8
Public
Grades PK-8
Public
Grades 9-12

Public
Grades 9-12
Public
Grades 6-12
4 Students
57
Communities
4,928
Units
21
Cities

64
Communities
3,986
Units
20
Cities

3,487
Communities
959,069
Units
894
Cities

25
Communities
2,084
Units
10
Cities

23
Communities
1,526
Units
14
Cities

23
Communities
2,901
Units
13
Cities
† Our analysis of utilities, groceries, transportation, healthcare, home prices, and other goods and services is sourced from the Cost of Living Index, a respected benchmark published by the Council for Community and Economic Research (C2ER) that provides a thorough overview of living expenses across different regions.
Rent data is provided by CoStar Group’s Market Trend reports. As the industry leader in commercial real estate information, analytics, and news, CoStar conducts extensive research to produce and maintain a comprehensive database of commercial real estate information. We combine this data with public record to provide the most up-to-date rental information available.
Consumer goods, services, and home prices are sourced from the Cost of Living Index published by the Council for Community and Economic Research (C2ER). The data on this page is updated quarterly. It was last published in February 2026.


