Forte at 1440 Beacon
1440 Beacon St,
Brookline, MA 02446
$2,785 - $3,712 Plus Fees
Studio - 1 Bed | 12 Month Lease

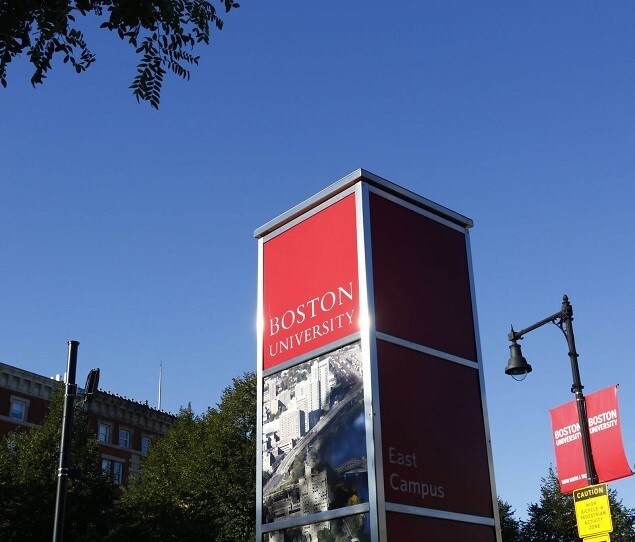
Although perhaps not the flashiest higher-learning institution in the city, Boston University is among the most respected research universities in the nation. The campus enjoys a superb location on the banks of the Charles River, practically right next door to Fenway Park and the stellar dining and nightlife of the Back Bay area. Hockey matches at Agganis Arena are wildly popular, with the Terriers consistently appearing in the NCAA semifinals. The surrounding area is a goldmine of restaurants, bars, nightclubs, entertainment venues, and scenic parks. MBTA service makes it easy to get around town, putting one of America’s most exciting and unique cities at your fingertips. The most affordable apartments and condos convenient to campus are on the west side, in the Packard’s Corner area; pricier options closer to Fenway will give you terrific access to both the university and the excellent attractions around the ballpark.
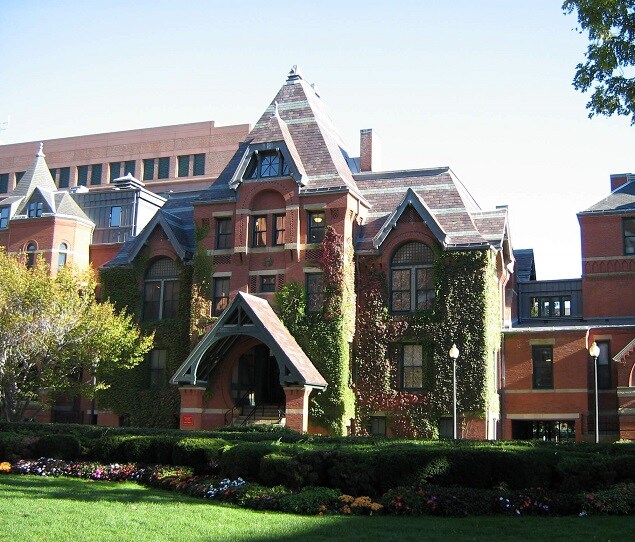
The School of Public Health is in the Talbot Building
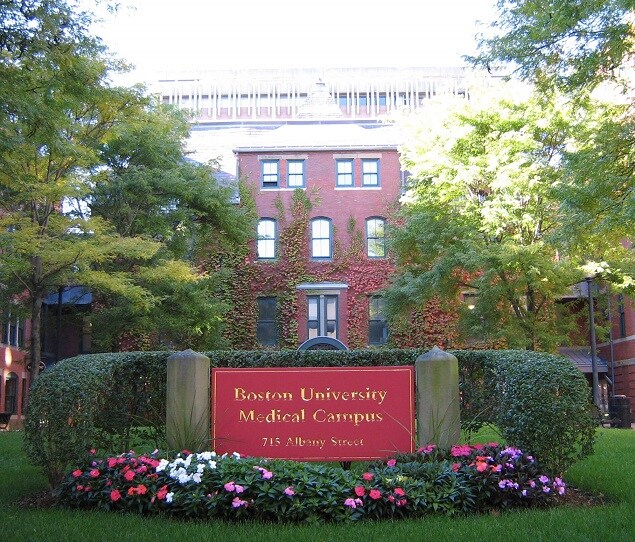
The Boston University School of Medicine was founded in 1848
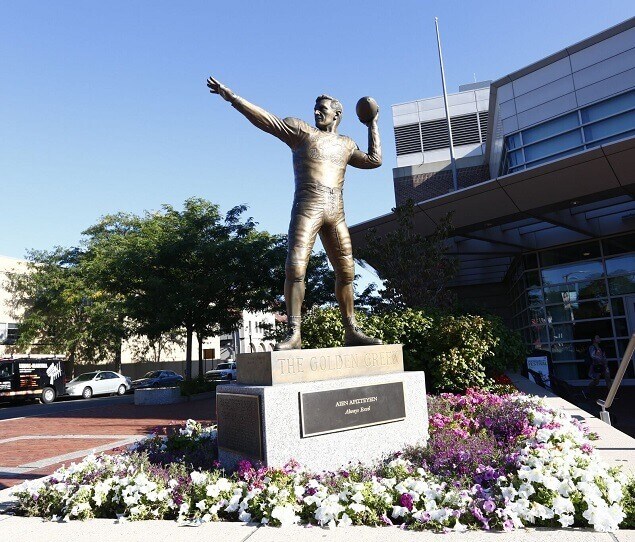
Statue of Harry Agganis outside of Agganis Arena
The John Hancock Student Village covers 10 acres
As of March 2026, the average apartment rent in Boston, MA is $2,843 for a studio, $3,433 for one bedroom, $4,308 for two bedrooms, and $5,684 for three bedrooms. Apartment rent in Boston has decreased by -0.2% in the past year.
Studio
483 sq ft
Average Sq Ft
$2,843/month
Average Rent
1 BR
698 sq ft
Average Sq Ft
$3,433/month
Average Rent
2 BR
972 sq ft
Average Sq Ft
$4,308/month
Average Rent
3 BR
1,215 sq ft
Average Sq Ft
$5,684/month
Average Rent
Walker's Paradise
out of 100 WalkScore® Rating
Lace up your walking shoes because this area is considered a walker’s paradise.
Excellent Transit
out of 100 TransitScore® Rating
You’ll have excellent transit living in this area, with several nearby transit stops.
Very Bikeable
out of 100 BikeScore® Rating
This area is very bikeable. You’ll find a variety of bike paths and lanes.
Public
Grades PK-6
295 Students

Public
Grades PK-6
100 Students
Public
Grades PK-8
779 Students

Public
Grades PK-8
544 Students
Public
Grades PK-6
196 Students
Public
Grades 7-12
2,382 Students
Public
Grades 7-12
1,518 Students
Public
Grades PK-8
779 Students
Public
Grades PK-8
544 Students
Public
Grades 7-12
1,669 Students

Public
Grades 7-12
2,382 Students
Public
Grades 7-12
1,518 Students
Public
Grades 7-12
1,669 Students
Public
Grades 6-12
565 Students

Public
Grades 9-12
480 Students

3,467
Communities
954,552
Units
893
Cities

714
Communities
198,723
Units
339
Cities

623
Communities
124,974
Units
245
Cities

620
Communities
172,612
Units
246
Cities

548
Communities
122,772
Units
218
Cities

459
Communities
108,697
Units
230
Cities
† Our analysis of utilities, groceries, transportation, healthcare, home prices, and other goods and services is sourced from the Cost of Living Index, a respected benchmark published by the Council for Community and Economic Research (C2ER) that provides a thorough overview of living expenses across different regions.
Rent data is provided by CoStar Group’s Market Trend reports. As the industry leader in commercial real estate information, analytics, and news, CoStar conducts extensive research to produce and maintain a comprehensive database of commercial real estate information. We combine this data with public record to provide the most up-to-date rental information available.
Consumer goods, services, and home prices are sourced from the Cost of Living Index published by the Council for Community and Economic Research (C2ER). The data on this page is updated quarterly. It was last published in February 2026.


