Median Age
42 Years
Largest Age Group
20-29 Years
Approximately 16% of Residents
Under 20
19%
Over 65
24%

Avg Rent
$1,611
Population
26,116
Renter Mix
45% Rent
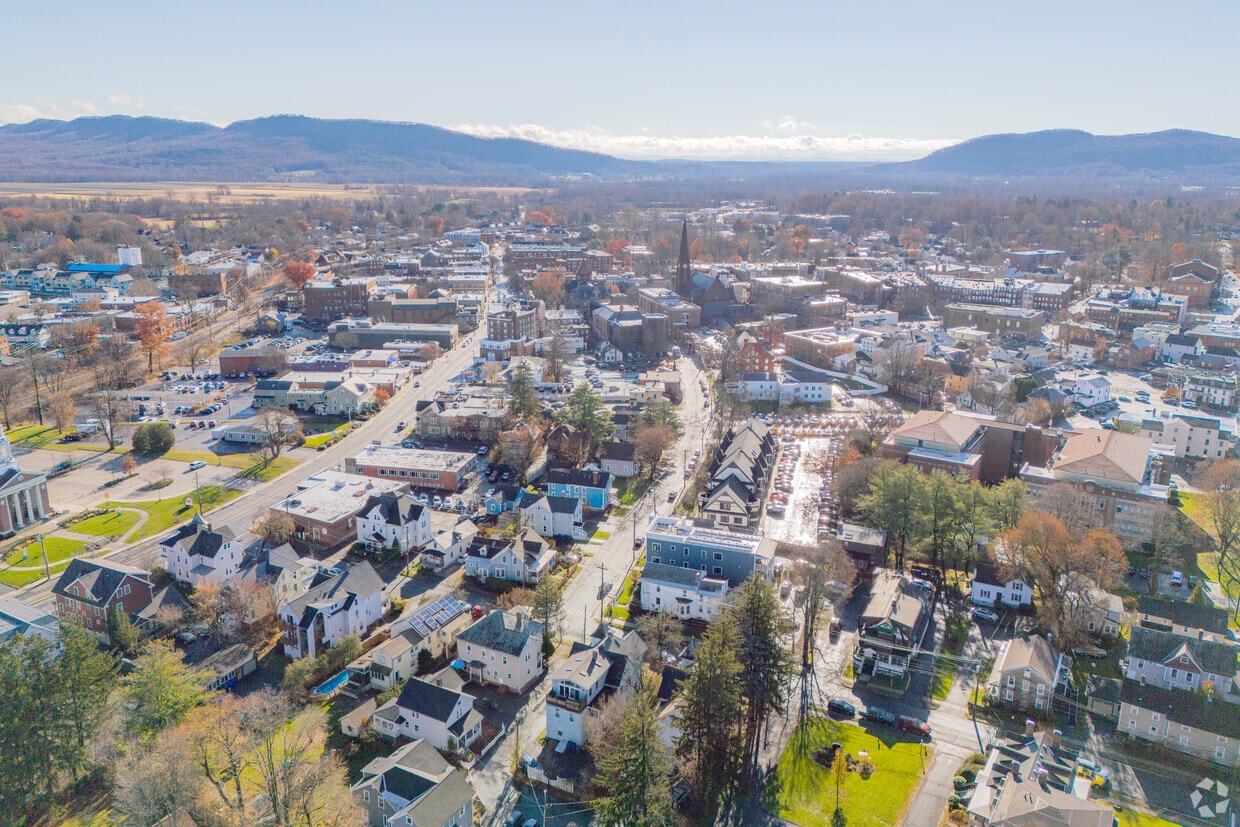
Northampton is a magical city full of academics, history, and the performing arts. Smith College, a private women’s college focused on liberal arts, is at the center of the city and gives Northampton that college town vibe. Smith College is surrounded by incredible locally-owned restaurants, historic theaters, conservation areas, libraries, and more.
The Academy of Music Theatre is a wonderful place for local entertainment since the 1890s. Calvin Theater, another historic concert hall, is also on the list of places to visit in Northampton. There’s a strong sense of pride in this community, and residents enjoy meeting up with one another at Northampton Brewery’s rooftop beer garden.
In the area, you’ll find public schools, well-maintained parks, country clubs, and public transportation that services Hampshire County. Northampton is a vibrant college town, artistic, and a music hub. Plus, it’s a great place to set down roots in Massachusetts!
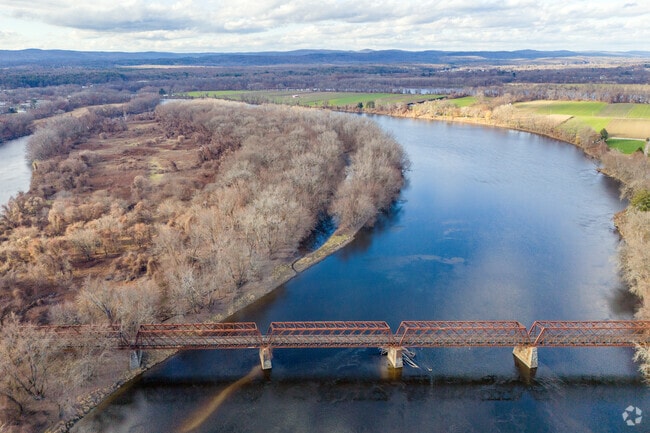
The Connecticut River graces the Eastern boundary of Northampton.
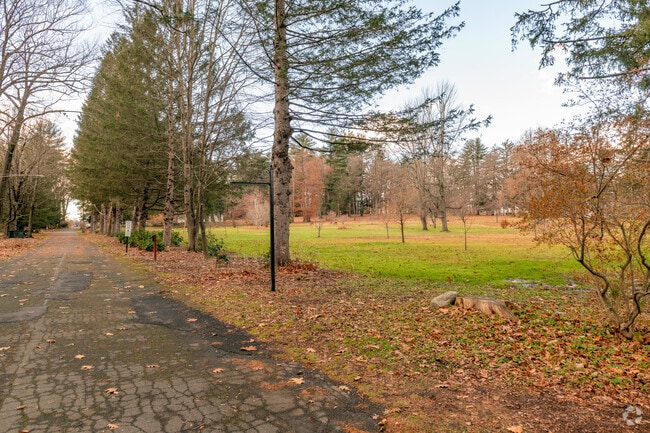
The Norwottuck Rail Trail runs through Northampton and is popular with cyclists and pedestrians.
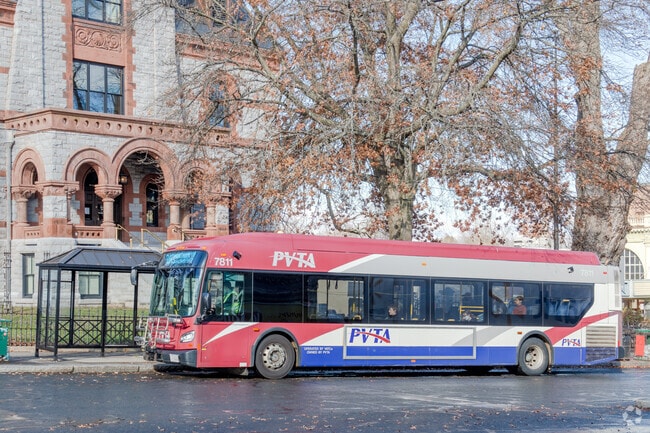
Bus lines are active in the Northampton area.
The Norwottuck Branch of the Mass Central Rail Trail crosses above Main Street in Northampton.
Pulaski Park is a downtown urban park enclave with benches and trees to delight pedestrians.
Shops along Main Street in Northampton are well-appointed and frequented by locals.
Median Household Income
$75,117
Average: $107,419
Education
13,246
Residents Have a Degree
Job Market
13,363
Workers Employed
Median Age
42 Years
Largest Age Group
20-29 Years
Approximately 16% of Residents
Under 20
19%
Over 65
24%
Housing Distribution
Northampton has more homeowners than renters.

Education Distribution
Review this city's overall education levels.

As of July 2026, the average apartment rent in Northampton, MA is $1,490 for a studio, $1,611 for one bedroom, $2,310 for two bedrooms, and $2,984 for three bedrooms. Apartment rent in Northampton has increased by 4.1% in the past year.
Explore how walkable, bikeable, drivable, and transit-friendly Northampton, MA is for everyday living.
Fairly Walkable
Walkability
Minimal Public Transit
Transit
Exceptionally Drivable
Drivability
Fairly Bikeable
Bikeability
Public
Grades PK-5
220 Students

Jackson Street Elementary School
Public
Grades K-5
253 Students

Bridge Street Elementary School
Public
Grades PK-5
273 Students

R. K. Finn Ryan Road Elementary School
Public
Grades K-5
220 Students

Public
Grades 6-8
570 Students
Public
Grades 9-12
846 Students

Public
Grades 9-12
846 Students
Smith Vocational and Agricultural High
Public
Grades 9-12
589 Students
† Our analysis of utilities, groceries, transportation, healthcare, home prices, and other goods and services is sourced from the Cost of Living Index, a respected benchmark published by the Council for Community and Economic Research (C2ER) that provides a thorough overview of living expenses across different regions.
Rent data is provided by CoStar Group’s Market Trend reports. As the industry leader in commercial real estate information, analytics, and news, CoStar conducts extensive research to produce and maintain a comprehensive database of commercial real estate information. We combine this data with public record to provide the most up-to-date rental information available.
Consumer goods, services, and home prices are sourced from the Cost of Living Index published by the Council for Community and Economic Research (C2ER). The data on this page is updated quarterly. It was last published in June 2026.
Demographic information comes from Neustar and combines detailed address data with U.S. Census and American Community Survey statistics to produce reliable local estimates.


