
Cambridge Ivy Inn
50-52 Irving St,
Cambridge, MA 02138
$1,600 - $2,550 Plus Fees
1 Bed

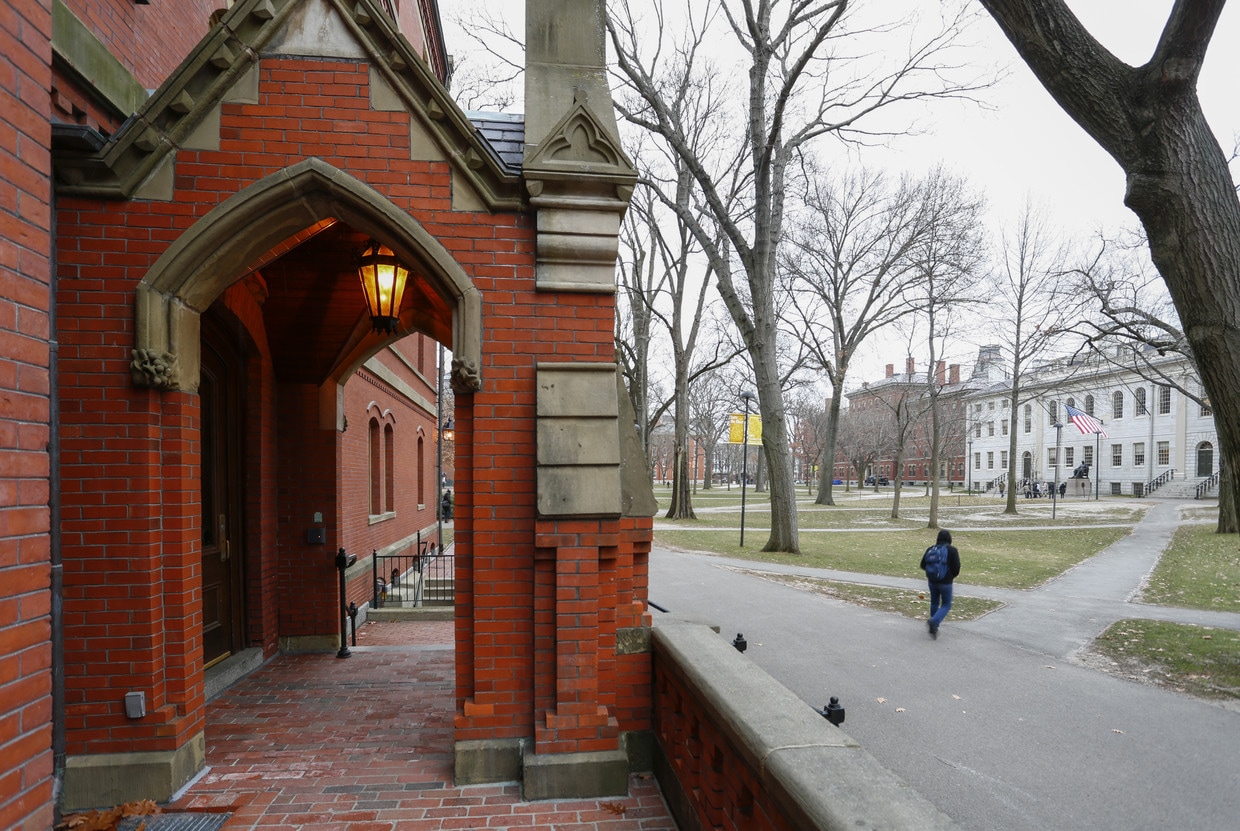
Mid-Cambridge is a predominantly residential neighborhood brimming with apartments and townhomes available for rent. Central Square, Harvard Square, and Inman Square are all within easy walking distance of Mid-Cambridge, providing residents with abundant options for shopping, dining, entertainment, and public transportation.
Harvard University and the Massachusetts Institute of Technology are both walkable from Mid-Cambridge as well, making the neighborhood a popular choice among students, faculty, and staff of these institutions. Lush surroundings and green spaces like Joan Lorentz Park and Harvard Yard lend a sense of serenity to the neighborhood while the shops, bars, and eateries of bustling Massachusetts Avenue ensure there is always something to do in Mid-Cambridge.
As of March 2026, the average apartment rent in Mid-Cambridge is $2,227 for a studio, $2,601 for one bedroom, $3,405 for two bedrooms, and $4,508 for three bedrooms. Apartment rent in Mid-Cambridge has decreased by -3.0% in the past year.
Studio
300 sq ft
Average Sq Ft
$2,227/month
Average Rent
1 BR
548 sq ft
Average Sq Ft
$2,601/month
Average Rent
2 BR
783 sq ft
Average Sq Ft
$3,405/month
Average Rent
3 BR
940 sq ft
Average Sq Ft
$4,508/month
Average Rent
Explore how walkable, bikeable, drivable, and transit-friendly Mid-Cambridge - Cambridge, MA is for everyday living.
Walker's Paradise
Lace up your walking shoes because this area is considered a walker’s paradise.
Excellent Transit
You’ll have excellent transit living in this area, with several nearby transit stops.
Biker's Paradise
Do you prefer to get around on two wheels? You’ll love living in this neighborhood, which is considered a biker’s paradise.
Current Resident
8 years and 2 months ago•Niche Review
I have lived in Harvard Square for the past 4 years and absolutely love it. We are close to downtown, yet far enough away to feel like i still live in a residential area. The culture in Harvard Square is awesome, it is diverse, safe, and surrounded by academically minded individuals. There is always much to do, from festivals, museums, and different ethnic food to eat.

3,490
Communities
959,772
Units
895
Cities

715
Communities
198,674
Units
340
Cities

625
Communities
174,401
Units
249
Cities

625
Communities
125,220
Units
245
Cities

557
Communities
125,188
Units
221
Cities

457
Communities
108,184
Units
229
Cities
† Our analysis of utilities, groceries, transportation, healthcare, home prices, and other goods and services is sourced from the Cost of Living Index, a respected benchmark published by the Council for Community and Economic Research (C2ER) that provides a thorough overview of living expenses across different regions.
Rent data is provided by CoStar Group’s Market Trend reports. As the industry leader in commercial real estate information, analytics, and news, CoStar conducts extensive research to produce and maintain a comprehensive database of commercial real estate information. We combine this data with public record to provide the most up-to-date rental information available.
Consumer goods, services, and home prices are sourced from the Cost of Living Index published by the Council for Community and Economic Research (C2ER). The data on this page is updated quarterly. It was last published in February 2026.


")


