
Falltree Apartments
19200 Lyndon B Johnson Fwy,
Mesquite, TX 75150
$910 - $2,550
Studio - 2 Beds
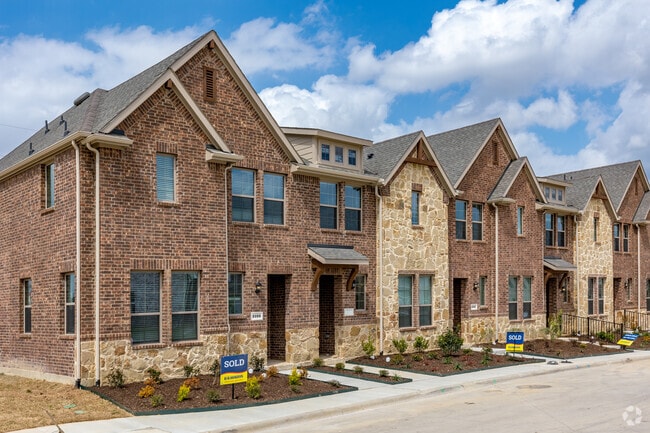

Welcome to Mesquite, Texas, a city that embraces its Western heritage while offering contemporary suburban living. Home to the renowned Mesquite Championship Rodeo, this Dallas suburb provides various housing options, from apartment communities to single-family homes. Average rent prices range from $985 for studios to $1,736 for three-bedroom units. The rental market shows stability, with changes ranging from a 0.9% decrease for two-bedroom units to a 4.2% increase for studio apartments. Notable areas include the historic Original Town district, the established Broadmoor Estates neighborhood, and the Lawson area.
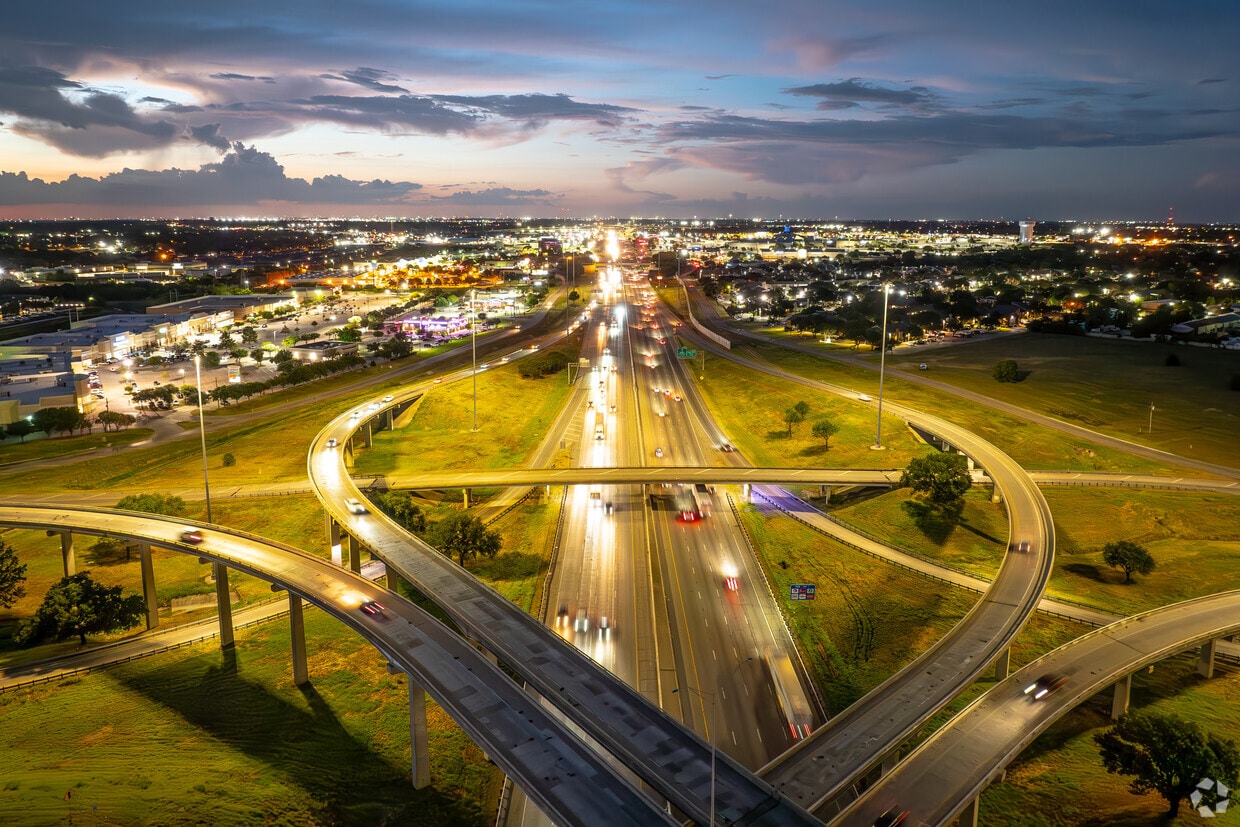
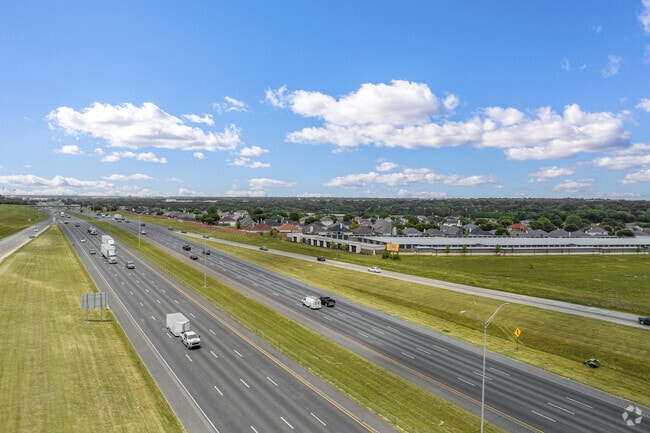
Mesquite features 76 public parks throughout the city, including the Heritage Trail system's 4.25 miles of hiking and biking paths. The Mesquite Arts Center spans 36,700 square feet and serves as home to the Mesquite Symphony Orchestra and local theater productions. Town East Mall provides shopping opportunities, while the city's location offers convenient access to major highways and the Mesquite Metro Airport. These transportation options connect residents to the broader Dallas-Fort Worth metroplex while maintaining the city's distinct character.
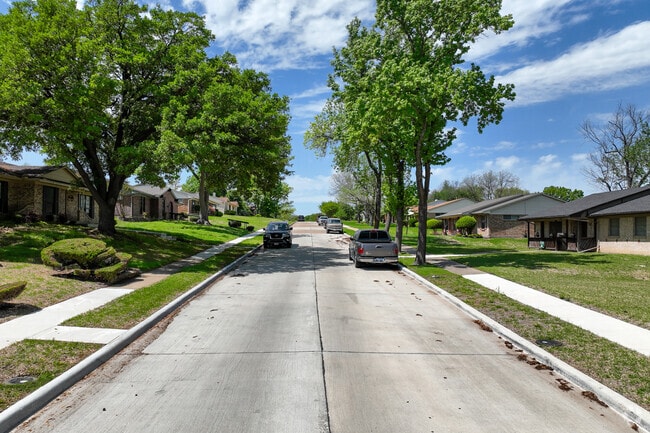
Pecan Bend is mostly residential, with quiet streets filling out the neighborhood.
Mesquite Highlands offers easy access via Interstate 635 for smooth commutes.
Mesquite Rodeo brings a touch of Texas tradition close to Mesquite Highlands.
Kick back at Westlake Park and relax while viewing the serene surroundings.
The Laneview DART rail line connects commuters from Mesquite to DFW and the STAR transit bus.
Mesquite
As of March 2026, the average apartment rent in Mesquite, TX is $1,001 for a studio, $1,084 for one bedroom, $1,363 for two bedrooms, and $1,604 for three bedrooms. Apartment rent in Mesquite has decreased by -1.9% in the past year.
Explore how walkable, bikeable, drivable, and transit-friendly Mesquite, TX is for everyday living.
Car-Dependent
This area is considered a car-dependent area and most errands will require a car.
Minimal Transit
You'll likely want a car when living in this area since it has few transit options.
Somewhat Bikeable
You might be able to find places to ride your bike in this area, but you’ll most likely want your car for most errands.
Public
Grades PK-5

Public
Grades PK-5
Public
Grades PK-5

Public
Grades PK-5
Public
Grades PK-5
Pioneer Technology (PTAA) Mesquite Middle
Public
Grades K-12

Public
Grades 6-8
Public
Grades 6-8

Public
Grades 6-8
Public
Grades 6-8
Pioneer Technology (PTAA) Mesquite Middle
Public
Grades K-12
Public
Grades 9-12

Public
Grades 9-12
Public
Grades 9-12

Public
Grades 9-12

82
Communities
15,527
Units
61
Cities

69
Communities
24,636
Units
29
Cities

12
Communities
2,731
Units
11
Cities

625
Communities
174,401
Units
249
Cities

54
Communities
13,127
Units
41
Cities

61
Communities
13,329
Units
31
Cities
† Our analysis of utilities, groceries, transportation, healthcare, home prices, and other goods and services is sourced from the Cost of Living Index, a respected benchmark published by the Council for Community and Economic Research (C2ER) that provides a thorough overview of living expenses across different regions.
Rent data is provided by CoStar Group’s Market Trend reports. As the industry leader in commercial real estate information, analytics, and news, CoStar conducts extensive research to produce and maintain a comprehensive database of commercial real estate information. We combine this data with public record to provide the most up-to-date rental information available.
Consumer goods, services, and home prices are sourced from the Cost of Living Index published by the Council for Community and Economic Research (C2ER). The data on this page is updated quarterly. It was last published in February 2026.


