Median Age
38 Years
Largest Age Group
15-24 Years
Approximately 17% of Residents
Under 20
28%
Over 65
19%

Avg Rent
$1,022
Population
6,795
Renter Mix
10% Rent
Few addresses on the Philadelphia Main Line balance history and convenience the way Merion Station does. Gilded Age estates and a quick SEPTA ride to Center City sit side by side here, drawing residents who want tree-lined streets and a close-knit community feel without sacrificing easy access to the city. Neighboring Narberth and Bala Cynwyd round out the dining and shopping scene, and most everyday errands are manageable on foot or by bike, though a car comes in handy for longer trips.
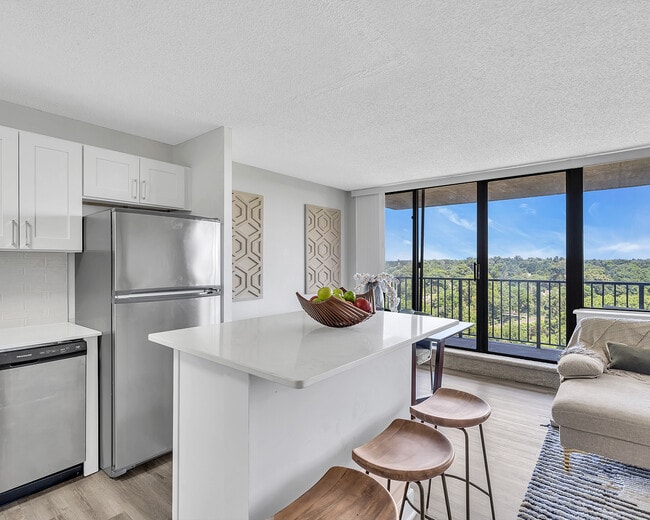
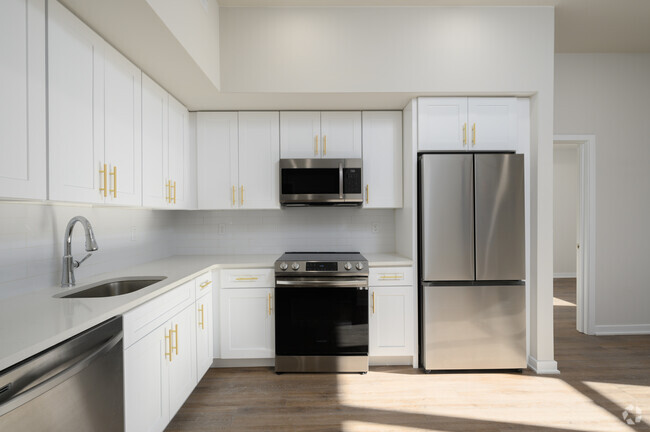
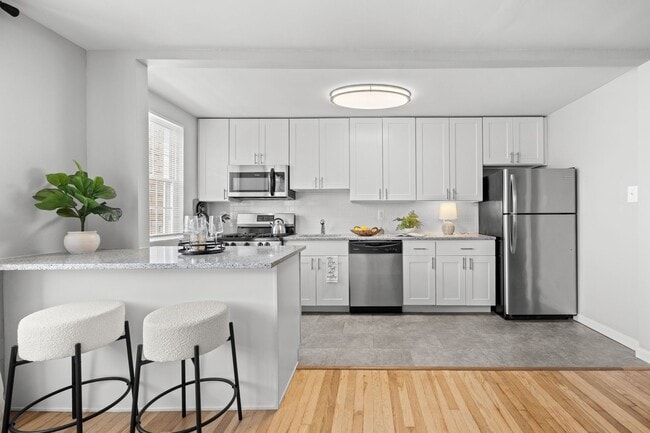
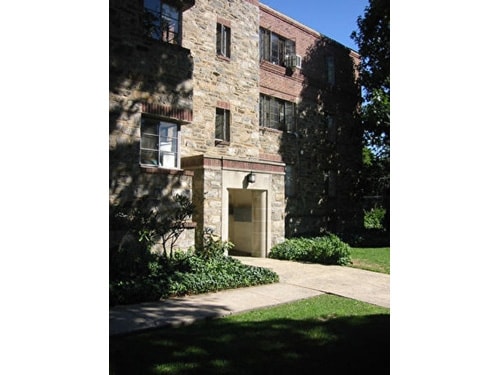
The housing stock reflects the area's storied character: century-old neo-Colonial estates with timber and stone exteriors share streets with Tudor-influenced twin homes, modern apartment communities, condos, and townhouses. Architecture here tends toward the substantial, and even the more modest properties carry a sense of permanence that newer suburbs rarely match.
Saint Joseph's University's Hawk Hill campus crosses into Merion Station along City Avenue, bringing Gothic-style buildings and Big 5 collegiate athletics to the doorstep. The Lower Merion School District serves the area and adds to its strong institutional foundation.
Median Household Income
$202,611
Average: $211,027
Education
3,723
Residents Have a Degree
Job Market
3,425
Workers Employed
Median Age
38 Years
Largest Age Group
15-24 Years
Approximately 17% of Residents
Under 20
28%
Over 65
19%
Housing Distribution
Merion Station has more homeowners than renters.

Education Distribution
Review this city's overall education levels.

As of September 2026, the average apartment rent in Merion Station, PA is $1,022 for one bedroom, and $1,349 for two bedrooms. Apartment rent in Merion Station has increased by 1.2% in the past year.
Explore how walkable, bikeable, drivable, and transit-friendly Merion Station, PA is for everyday living.
Moderately Walkable
Walkability
Good Public Transit
Transit
Moderately Drivable
Drivability
Moderately Bikeable
Bikeability

Public
Grades K-5
438 Students

 The GreatSchools Rating helps parents compare schools within a state based on a variety of school quality indicators and provides a helpful picture of how effectively each school serves all of its students. Ratings are on a scale of 1 (below average) to 10 (above average) and can include test scores, college readiness, academic progress, advanced courses, equity, discipline and attendance data. We also advise parents to visit schools, consider other information on school performance and programs, and consider family needs as part of the school selection process.
View GreatSchools Rating Methodology
Data provided by
GreatSchools.org
© 2026. All rights reserved.
The GreatSchools Rating helps parents compare schools within a state based on a variety of school quality indicators and provides a helpful picture of how effectively each school serves all of its students. Ratings are on a scale of 1 (below average) to 10 (above average) and can include test scores, college readiness, academic progress, advanced courses, equity, discipline and attendance data. We also advise parents to visit schools, consider other information on school performance and programs, and consider family needs as part of the school selection process.
View GreatSchools Rating Methodology
Data provided by
GreatSchools.org
© 2026. All rights reserved.
† Our analysis of utilities, groceries, transportation, healthcare, home prices, and other goods and services is sourced from the Cost of Living Index, a respected benchmark published by the Council for Community and Economic Research (C2ER) that provides a thorough overview of living expenses across different regions.
Rent data is provided by CoStar Group’s Market Trend reports. As the industry leader in commercial real estate information, analytics, and news, CoStar conducts extensive research to produce and maintain a comprehensive database of commercial real estate information. We combine this data with public record to provide the most up-to-date rental information available.
Consumer goods, services, and home prices are sourced from the Cost of Living Index published by the Council for Community and Economic Research (C2ER). The data on this page is updated quarterly. It was last published in September 2026.
Demographic information comes from Neustar and combines detailed address data with U.S. Census and American Community Survey statistics to produce reliable local estimates.