Median Age
40 Years
Largest Age Group
30-39 Years
Approximately 14% of Residents
Under 20
25%
Over 65
21%

Avg Rent
$1,297
Population
39,244
Renter Mix
32% Rent
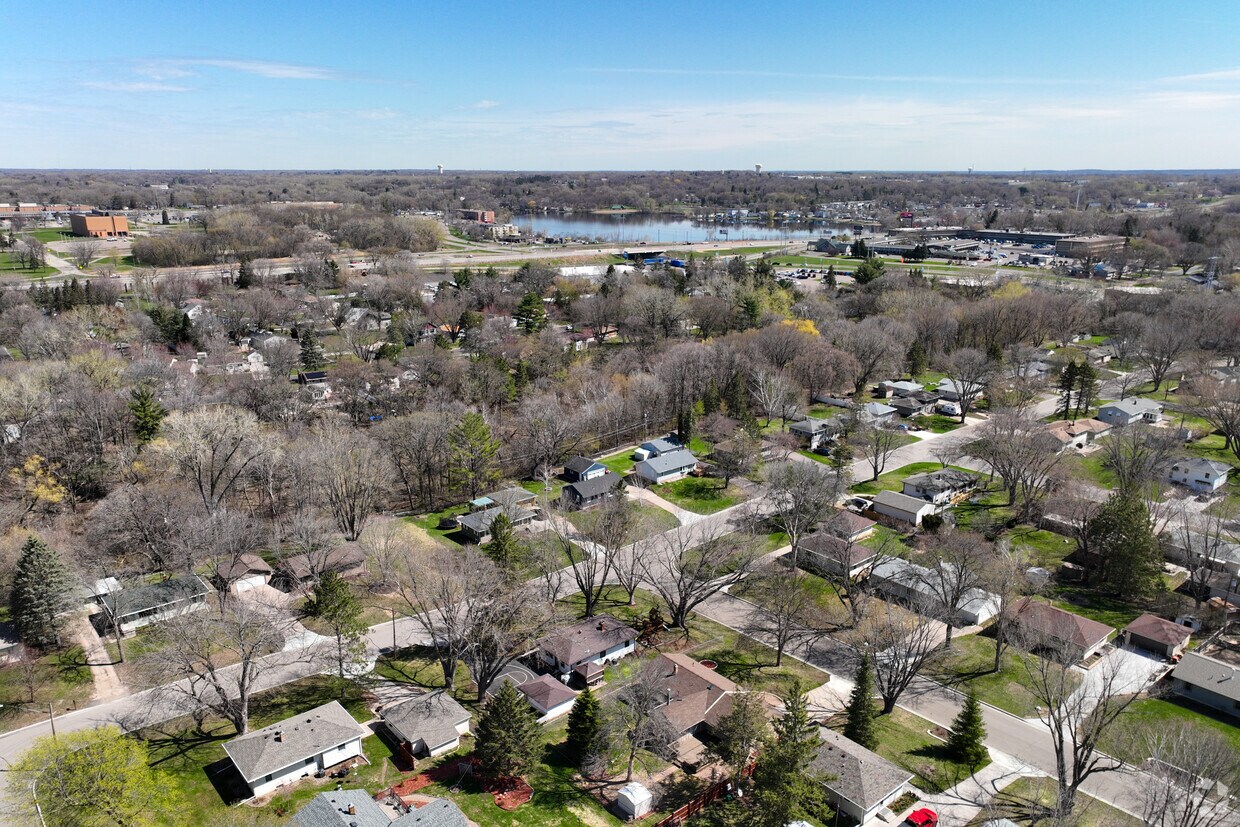
Maplewood is where the 3M Corporation chose to plant its global headquarters — and it’s easy to see why the city made such a strong impression. Sitting just ten minutes from downtown Saint Paul and stretching along its northern and eastern borders, Maplewood delivers a quieter pace without cutting you off from the Twin Cities. Battle Creek Regional Park connects cyclists directly to Saint Paul and Minneapolis through well-maintained trails, while Keller Golf Course gives outdoor enthusiasts a local retreat. The Maplewood Mall anchors a solid stretch of retail and dining options, and the live music venue Myth draws big-name acts right to the suburbs.
Renters will find a solid mix of apartment communities and townhomes spread across the city’s 19 square miles. Whether you’re after a spacious two-bedroom or a cozy studio, the rental landscape here covers a wide range of layouts and price points. With Saint Paul easily accessible for work or a night out, and Minneapolis not far beyond that, Maplewood gives you the breathing room of a suburb with the convenience of the metro right at your doorstep.
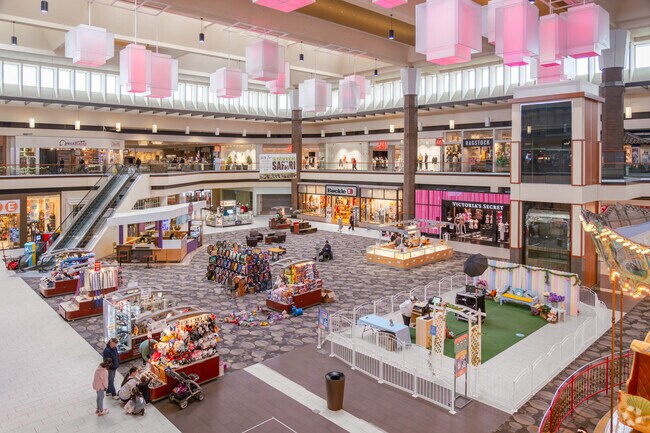
Maplewood Mall has a variety of different stores, businesses and small booths.
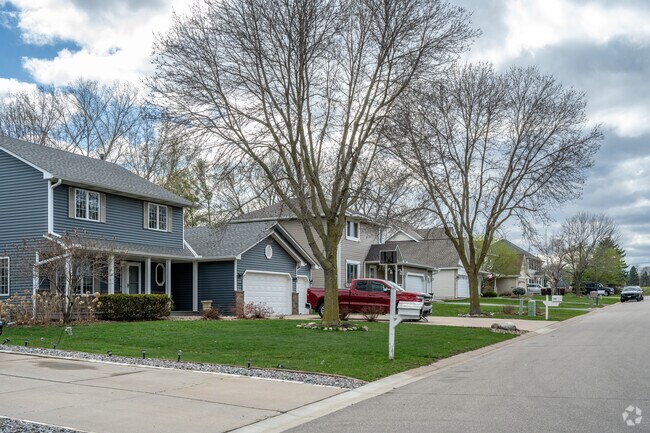
Rows of modern craftsman-style homes are a common sight in Maplewood.
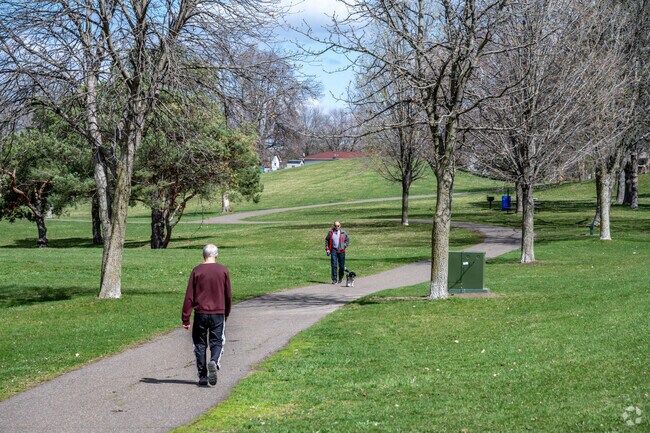
The Maplewood Nature Center's trail walks are open dawn to dusk daily.
The Battle Creek Dog Park is on the south side of the Battle Creek Park.
Maplewood residents fill out the Dog House Bar & Grill for the food, drinks, and atmosphere.
The playground at Applewood Park Preserve is surrounded by large trees.
Median Household Income
$80,079
Average: $100,168
Education
10,949
Residents Have a Degree
Job Market
20,264
Workers Employed
Median Age
40 Years
Largest Age Group
30-39 Years
Approximately 14% of Residents
Under 20
25%
Over 65
21%
Housing Distribution
Maplewood has more homeowners than renters.

Education Distribution
Review this city's overall education levels.

As of July 2026, the average apartment rent in Maplewood, MN is $1,184 for a studio, $1,297 for one bedroom, $1,519 for two bedrooms, and $1,964 for three bedrooms. Apartment rent in Maplewood has increased by 0.9% in the past year.
Explore how walkable, bikeable, drivable, and transit-friendly Maplewood, MN is for everyday living.
Moderately Walkable
Walkability
Some Public Transit
Transit
Very Drivable
Drivability
Moderately Bikeable
Bikeability
Public
Grades K-5
436 Students

Public
Grades K-5
436 Students
Public
Grades PK-5
878 Students

Public
Grades PK-5
878 Students
Public
Grades PK-5
442 Students

Public
Grades 6-8
1,073 Students
Public
Grades 6-8
985 Students
Public
Grades 6-8
557 Students

Fairview Adolescent Education Progr
Public
Grades K-12
20 Students
Public
Grades 6-12
6 Students
Fairview Adolescent Education Progr
Public
Grades K-12
20 Students
Public
Grades 6-12
6 Students
Public
Grades 6-12
† Our analysis of utilities, groceries, transportation, healthcare, home prices, and other goods and services is sourced from the Cost of Living Index, a respected benchmark published by the Council for Community and Economic Research (C2ER) that provides a thorough overview of living expenses across different regions.
Rent data is provided by CoStar Group’s Market Trend reports. As the industry leader in commercial real estate information, analytics, and news, CoStar conducts extensive research to produce and maintain a comprehensive database of commercial real estate information. We combine this data with public record to provide the most up-to-date rental information available.
Consumer goods, services, and home prices are sourced from the Cost of Living Index published by the Council for Community and Economic Research (C2ER). The data on this page is updated quarterly. It was last published in June 2026.
Demographic information comes from Neustar and combines detailed address data with U.S. Census and American Community Survey statistics to produce reliable local estimates.


