
The Pavilions
345 Buckland Hills Dr,
Manchester, CT 06042
$1,699 - $2,699 Plus Fees
1-3 Beds

Welcome to Manchester, Connecticut, where historic charm meets contemporary living. Originally known as "Silk City" for its textile heritage, Manchester offers an array of rental options, from converted mill apartments to modern communities. The Cheney Brothers Historic District features distinctive loft-style apartments in restored mill buildings, while downtown Manchester provides both classic and new housing options steps from local shops and dining.
Manchester's outdoor spaces include the 53-acre Oak Grove Nature Center and Case Mountain Recreational Area, where trails lead to panoramic views of the Hartford skyline. The community celebrates its heritage through the Lutz Children's Museum, Fire Museum, and performances at the historic Cheney Hall. Manchester Community College enhances the area's educational landscape, while the Manchester Road Race, New England's second-largest running event, brings the community together each Thanksgiving. Charter Oak Park offers recreational facilities including basketball courts, soccer fields, and a musical playground. The Shoppes at Buckland Hills serves as a primary retail destination, while Shady Glen, a James Beard Foundation "American Classic" award recipient, remains a beloved local landmark.
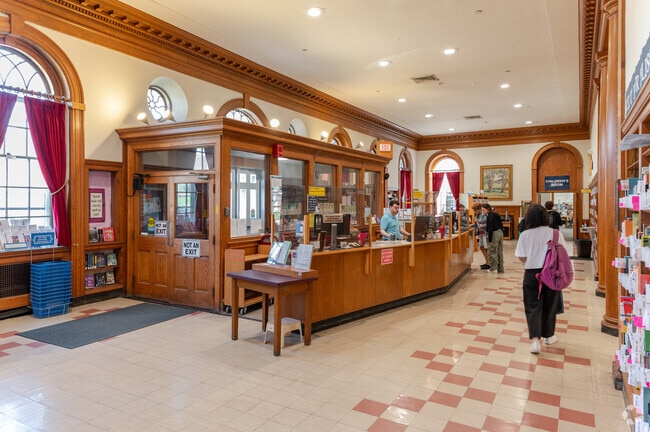
The main level of the Mary Cheney Library sees a ton of traffic
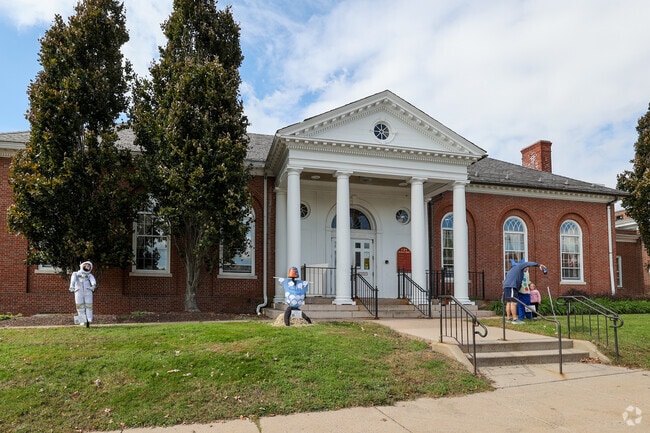
The Mary Cheney Library is home to paintings from Russell Cheney.
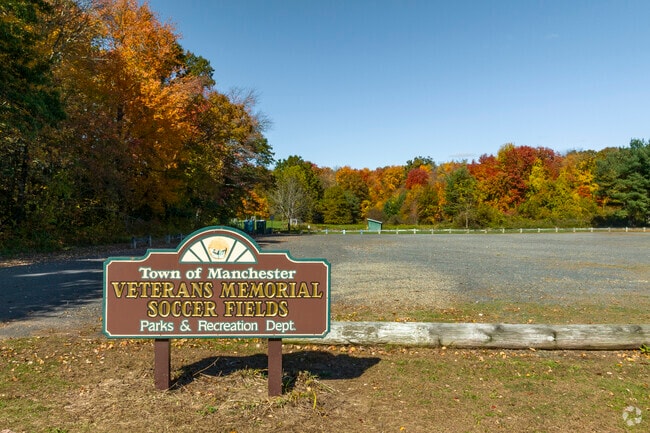
The Veterans Memorial Soccer Fields lot has ample parking for the numerous simultaneous games.
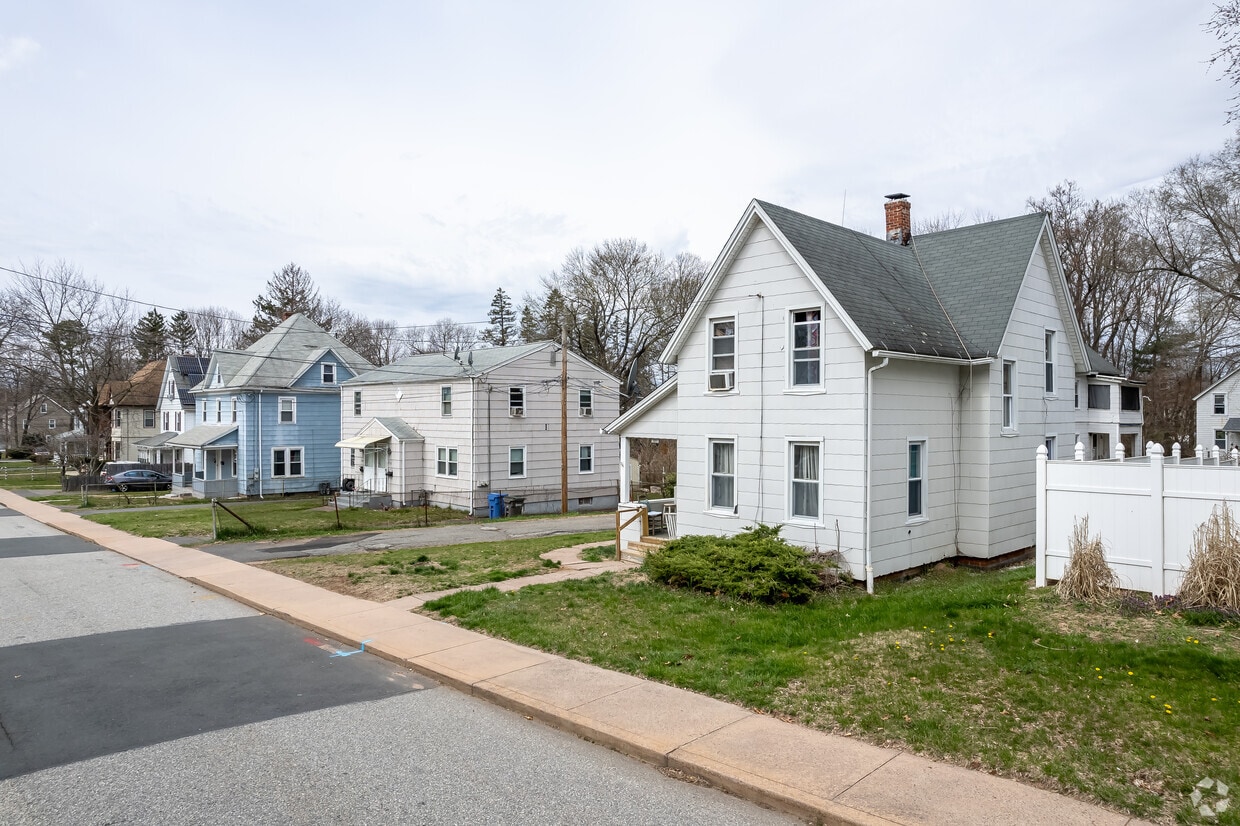
Wetherell Road neighborhoods feature open lawns with moderate backyard space.
Bowers residents have plenty of places to walk their dogs.
While most homes in Waddell are freestanding there are some townhouse condo complexes.
As of March 2026, the average apartment rent in Manchester, CT is $1,406 for a studio, $1,677 for one bedroom, $2,028 for two bedrooms, and $2,391 for three bedrooms. Apartment rent in Manchester has increased by 1.9% in the past year.
Explore how walkable, bikeable, drivable, and transit-friendly Manchester, CT is for everyday living.
Somewhat Walkable
You might be able to get out and walk when living in this area. Some errands can be accomplished on foot, but for others you’ll need a car.
Minimal Transit
You'll likely want a car when living in this area since it has few transit options.
Somewhat Bikeable
You might be able to find places to ride your bike in this area, but you’ll most likely want your car for most errands.
Public
Grades K-5

Public
Grades PK-8

Public
Grades K-5

Public
Grades PK-5

Public
Grades PK-5
Public
Grades PK-8
Public
Grades 6-8
Public
Grades 9-12

58
Communities
14,173
Units
40
Cities
39
Communities
5,475
Units
26
Cities

25
Communities
2,131
Units
18
Cities

13
Communities
1,944
Units
9
Cities

75
Communities
20,184
Units
52
Cities

53
Communities
7,008
Units
40
Cities
† Our analysis of utilities, groceries, transportation, healthcare, home prices, and other goods and services is sourced from the Cost of Living Index, a respected benchmark published by the Council for Community and Economic Research (C2ER) that provides a thorough overview of living expenses across different regions.
Rent data is provided by CoStar Group’s Market Trend reports. As the industry leader in commercial real estate information, analytics, and news, CoStar conducts extensive research to produce and maintain a comprehensive database of commercial real estate information. We combine this data with public record to provide the most up-to-date rental information available.
Consumer goods, services, and home prices are sourced from the Cost of Living Index published by the Council for Community and Economic Research (C2ER). The data on this page is updated quarterly. It was last published in February 2026.


