Median Age
33 Years
Largest Age Group
25-34 Years
Approximately 33% of Residents
Under 20
18%
Over 65
8%
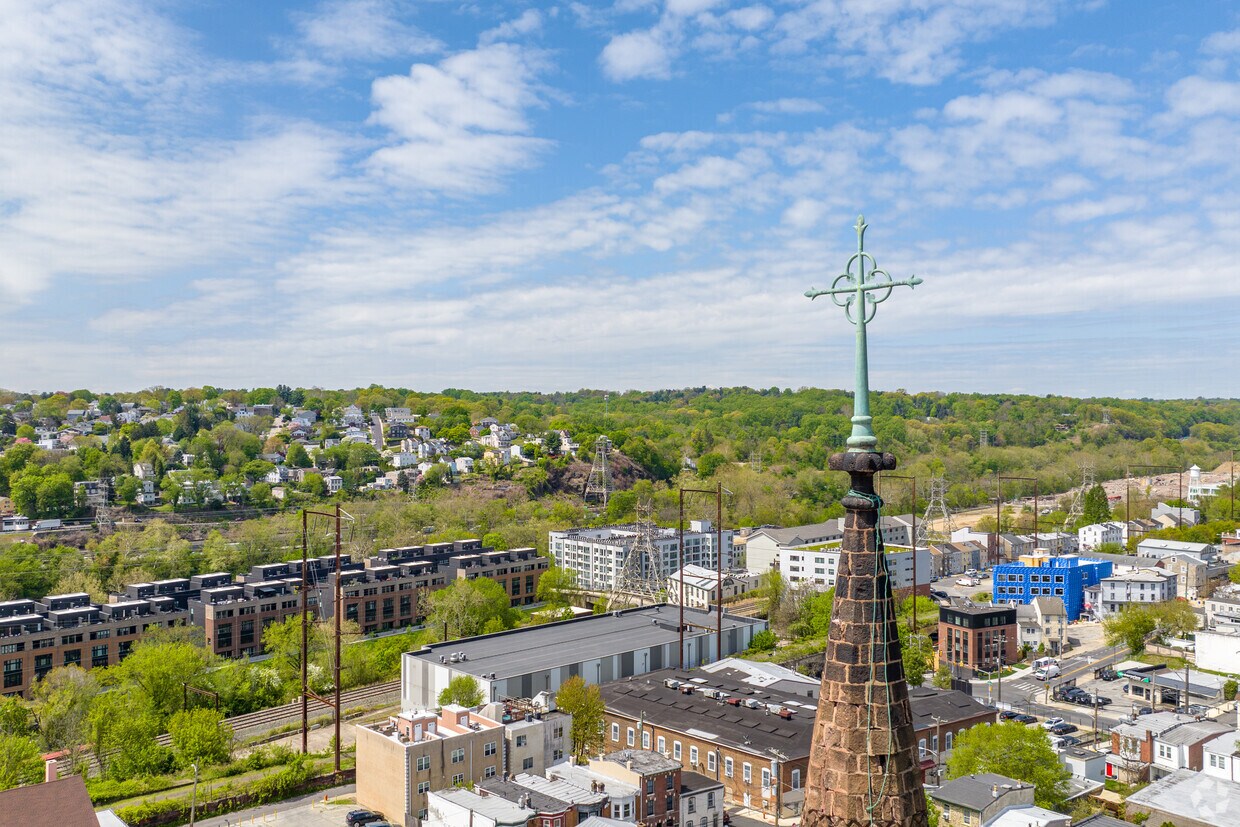
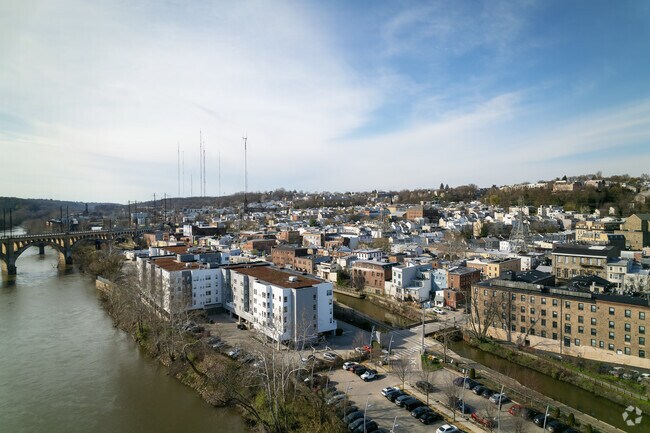
Along the Schuylkill River in Northwest Philadelphia, Manayunk combines historic charm with contemporary appeal. This former mill town retains its industrial heritage through preserved architecture and character. Row homes line the neighborhood's steep, cobblestone streets, creating a distinct atmosphere within Philadelphia's city limits. Main Street, the neighborhood's center, houses locally-owned shops, art galleries, and restaurants in restored 19th-century buildings. According to recent data, rental options in nearby areas range from approximately $1,500 to $2,500 monthly, with Bala Cynwyd showing one-bedroom units averaging around $1,986.
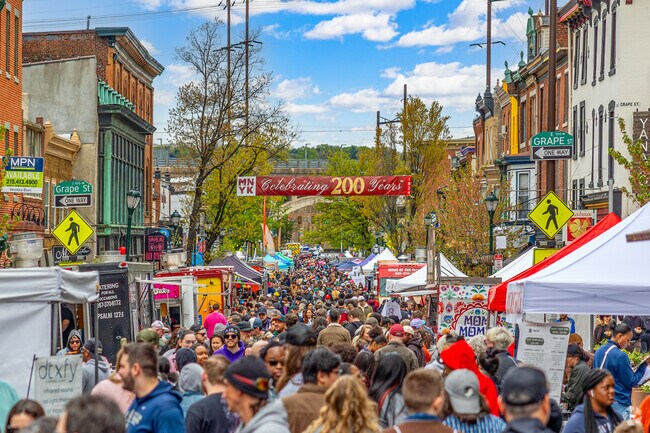
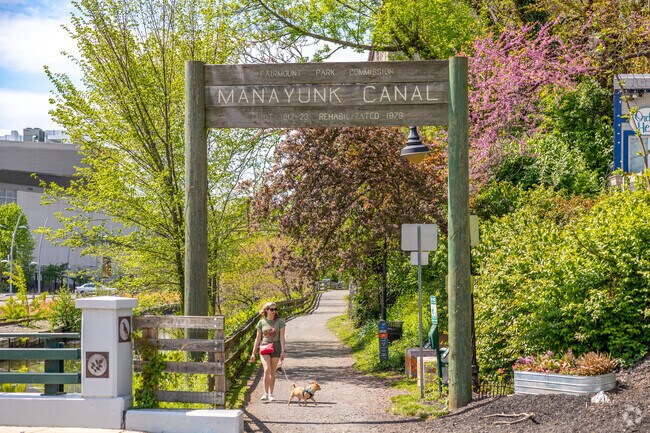
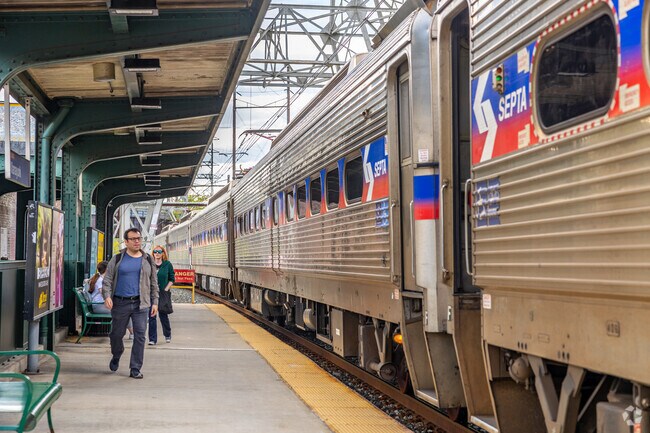
The Schuylkill River Trail and towpath offer opportunities for cycling, running, and riverside walks. The neighborhood's name comes from the Lenape word "Manaiung," meaning "place to drink," highlighting its connection to the river. The SEPTA Regional Rail at Manayunk Station provides direct access to Center City Philadelphia. Each June, the Manayunk Arts Festival transforms Main Street into the region's largest outdoor juried art festival, attracting art enthusiasts from across the region. With its historic architecture, outdoor recreation options, and convenient transit connections, Manayunk offers a distinctive Philadelphia living experience.
Manayunk celebrates 200 years strong with community activities like Manayunk StrEAT Festival.
Walk the dog on the Schuylkill River Trail along the Manayunk Canal.
Get to Center City Philadelphia on Septa Regional Rail from Manayunk Station.
SOMO Manayunk is a new American eatery offering small plates, sandwiches & elevated entrees.
Manayunk's walkable Main Street invites families to arts and dining at golden hour.
Manayunk row homes sit elevated above sidewalks with small gardens to tend.
Median Household Income
$93,606
Average: $114,794
Education
4,082
Residents Have a Degree
Job Market
4,623
Workers Employed
Median Age
33 Years
Largest Age Group
25-34 Years
Approximately 33% of Residents
Under 20
18%
Over 65
8%
Housing Distribution
Manayunk has more renters than homeowners.

Education Distribution
Review this city's overall education levels.

Explore how walkable, bikeable, drivable, and transit-friendly Manayunk, PA is for everyday living.
Fairly Walkable
Walkability
Good Public Transit
Transit
Moderately Drivable
Drivability
Moderately Bikeable
Bikeability
† Our analysis of utilities, groceries, transportation, healthcare, home prices, and other goods and services is sourced from the Cost of Living Index, a respected benchmark published by the Council for Community and Economic Research (C2ER) that provides a thorough overview of living expenses across different regions.
Rent data is provided by CoStar Group’s Market Trend reports. As the industry leader in commercial real estate information, analytics, and news, CoStar conducts extensive research to produce and maintain a comprehensive database of commercial real estate information. We combine this data with public record to provide the most up-to-date rental information available.
Consumer goods, services, and home prices are sourced from the Cost of Living Index published by the Council for Community and Economic Research (C2ER). The data on this page is updated quarterly. It was last published in June 2026.
Demographic information comes from Neustar and combines detailed address data with U.S. Census and American Community Survey statistics to produce reliable local estimates.


