Median Age
42 Years
Largest Age Group
35-44 Years
Approximately 15% of Residents
Under 20
21%
Over 65
19%
Avg Rent
$2,294
Population
19,729
Renter Mix
52% Rent
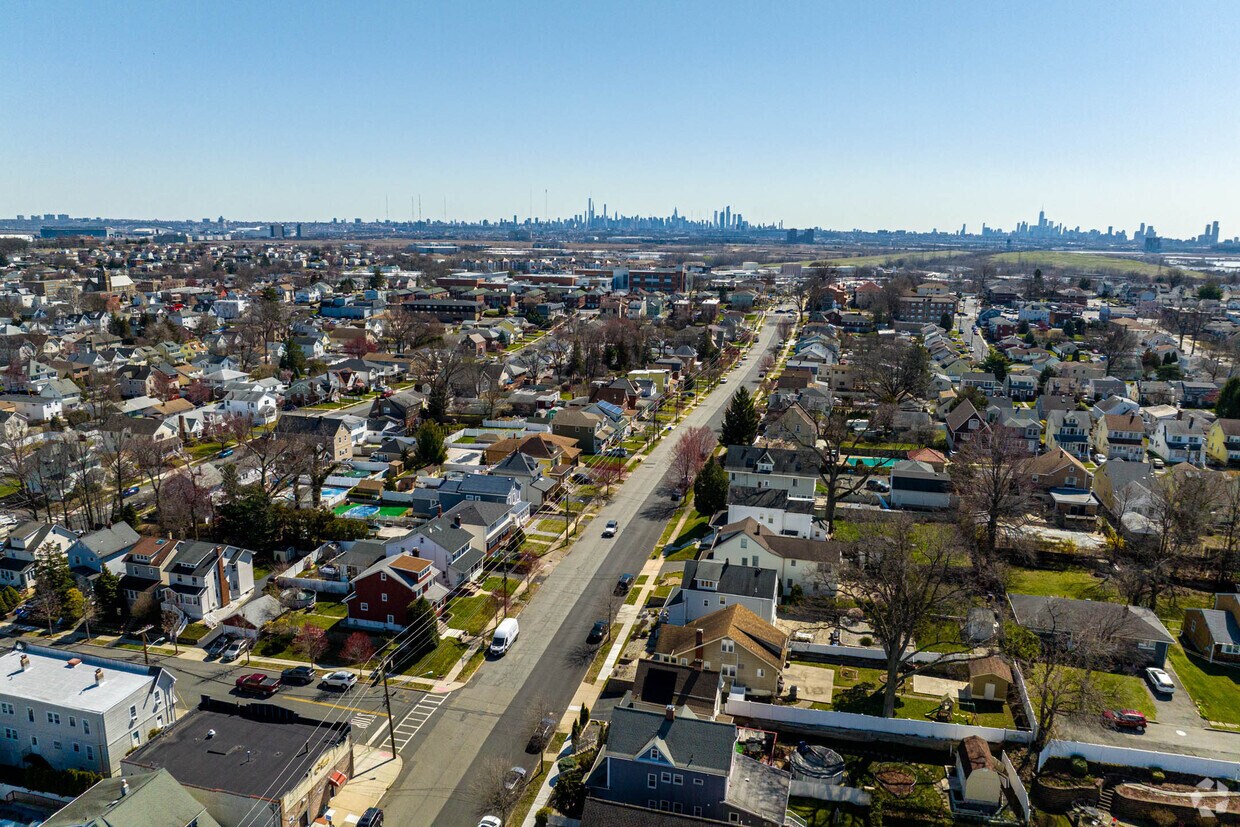
Lyndhurst, New Jersey sits just a few miles west of Manhattan's skyline, giving it the proximity of a big city without the nonstop pace that comes with it. This Bergen County township has long served as a practical, grounded base for commuters who value a real neighborhood feel over high-rise anonymity. NJ Transit rail service connects residents directly to New York Penn Station, making the daily ride into the city a straightforward part of the routine. Lyndhurst is also close to the Meadowlands Sports Complex, home to MetLife Stadium, which brings a certain energy to the area on game days.
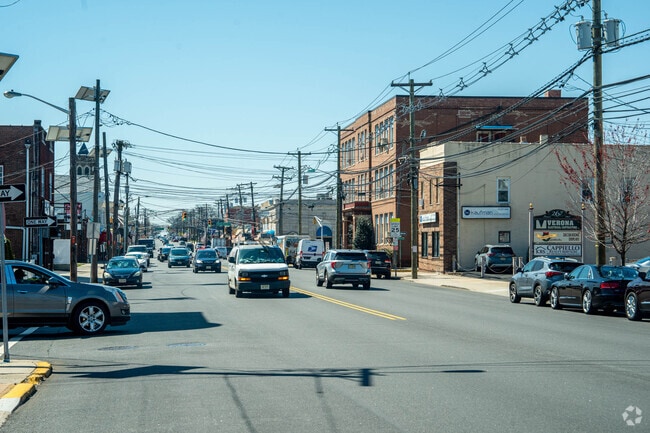
The township is made up of walkable residential streets lined with single-family homes alongside a solid mix of apartment communities, garden-style complexes, and converted multi-family buildings. Renters can choose from classic brick walk-ups to updated units with more contemporary finishes depending on the neighborhood. Areas near Ridge Road and Stuyvesant Avenue offer easy access to everyday shopping and dining without requiring a car. Felician University is located nearby in Rutherford, adding an academic presence to the broader community. With a strong sense of place and quick access to both New York City and major New Jersey employment hubs, Lyndhurst offers a steady, connected way of living.
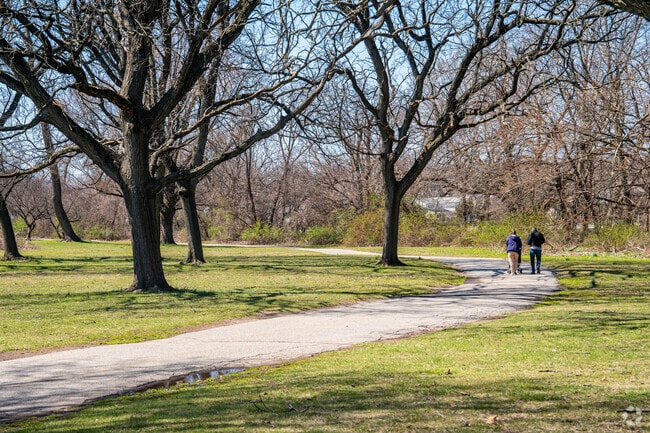
Walking trails in Lyndhurst parks are popular on sunny days.
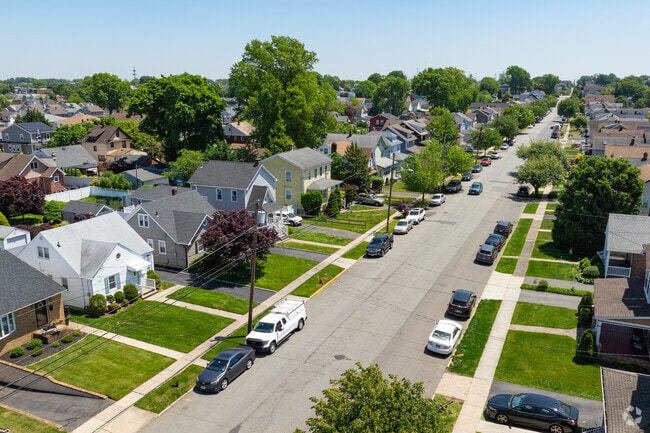
Lyndhurst’s residential grid is lined with homes and offers walkable streetscapes.
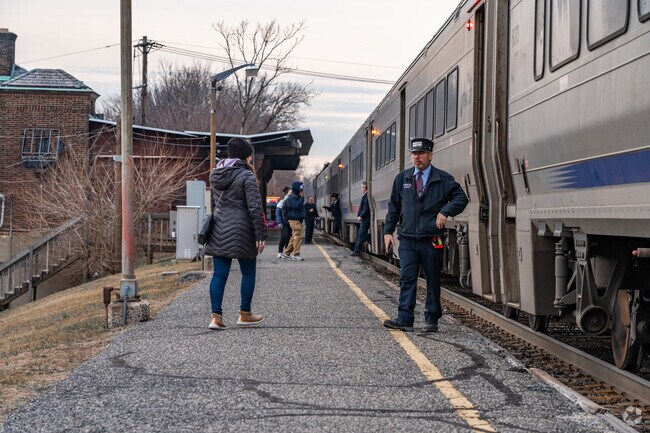
Lyndhurst’s train station connects residents to destinations across New Jersey.
Lyndhurst Municipal Park is a central green space for families and events.
Riverside County Park in Lyndhurst includes tennis courts and a baseball field.
Lyndhurst is a small New Jersey suburb in the Meadowlands region.
Median Household Income
$93,060
Average: $112,698
Education
6,623
Residents Have a Degree
Job Market
10,908
Workers Employed
Median Age
42 Years
Largest Age Group
35-44 Years
Approximately 15% of Residents
Under 20
21%
Over 65
19%
Housing Distribution
Lyndhurst has more renters than homeowners.

Education Distribution
Review this city's overall education levels.

As of July 2026, the average apartment rent in Lyndhurst, NJ is $2,196 for a studio, $2,294 for one bedroom, $3,054 for two bedrooms, and $3,257 for three bedrooms. Apartment rent in Lyndhurst has increased by 0.5% in the past year.
Explore how walkable, bikeable, drivable, and transit-friendly Lyndhurst, NJ is for everyday living.
Fairly Walkable
Walkability
Limited Public Transit
Transit
Exceptionally Drivable
Drivability
Moderately Bikeable
Bikeability
Public
Grades K-5
295 Students

Public
Grades K-5
237 Students
Public
Grades K-8
256 Students

Public
Grades K-5
196 Students
Public
Grades PK-5
162 Students
Public
Grades 6-8
610 Students
Public
Grades K-8
256 Students
Public
Grades 9-12
841 Students
† Our analysis of utilities, groceries, transportation, healthcare, home prices, and other goods and services is sourced from the Cost of Living Index, a respected benchmark published by the Council for Community and Economic Research (C2ER) that provides a thorough overview of living expenses across different regions.
Rent data is provided by CoStar Group’s Market Trend reports. As the industry leader in commercial real estate information, analytics, and news, CoStar conducts extensive research to produce and maintain a comprehensive database of commercial real estate information. We combine this data with public record to provide the most up-to-date rental information available.
Consumer goods, services, and home prices are sourced from the Cost of Living Index published by the Council for Community and Economic Research (C2ER). The data on this page is updated quarterly. It was last published in June 2026.
Demographic information comes from Neustar and combines detailed address data with U.S. Census and American Community Survey statistics to produce reliable local estimates.


