Median Age
43 Years
Largest Age Group
40-49 Years
Approximately 15% of Residents
Under 20
22%
Over 65
20%
Avg Rent
$1,974
Population
29,875
Renter Mix
36% Rent
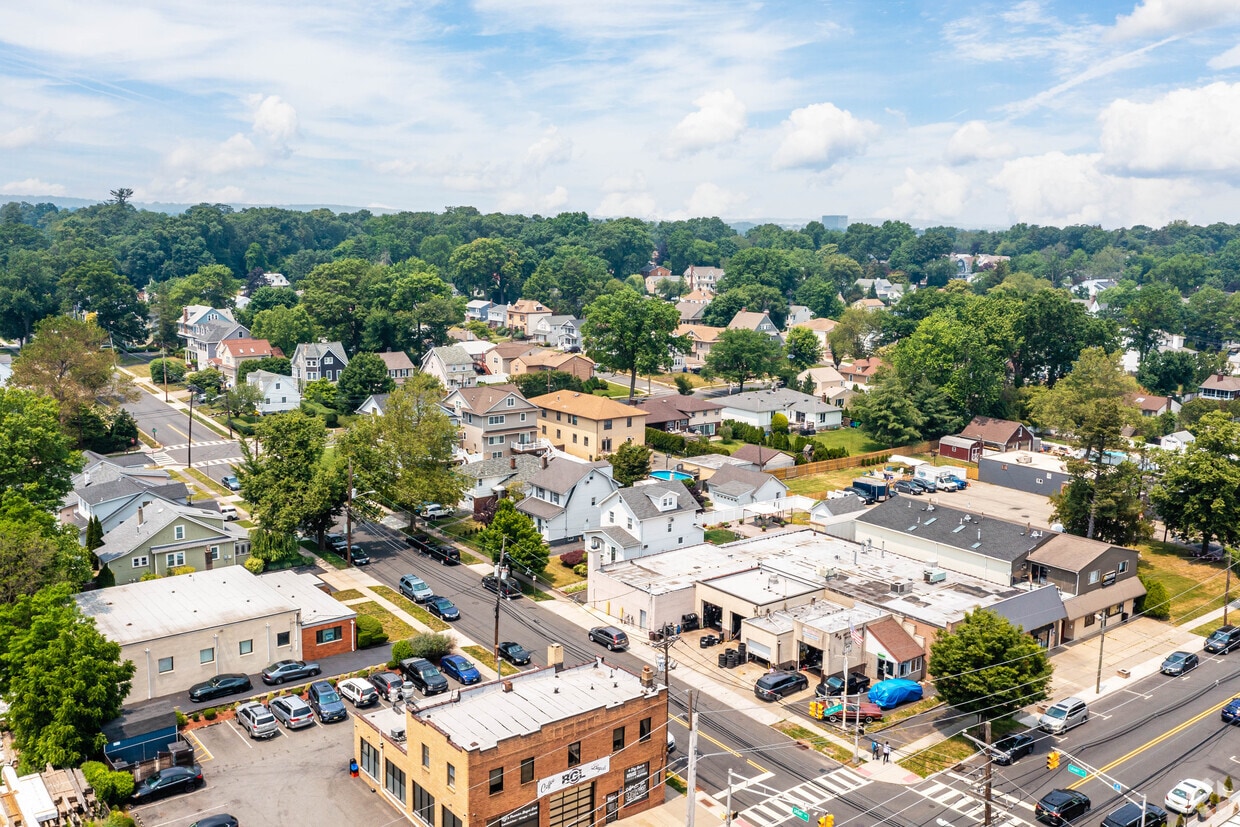
Nutley, NJ sits just 15 miles from Midtown Manhattan, giving it that rare quality of feeling genuinely removed from city life while staying closely connected to one of the world's busiest economic centers. Tucked into Essex County along the Passaic River, this compact township covers only four square miles yet holds a population of nearly 30,000 residents, making it one of the more densely settled communities in the Garden State.
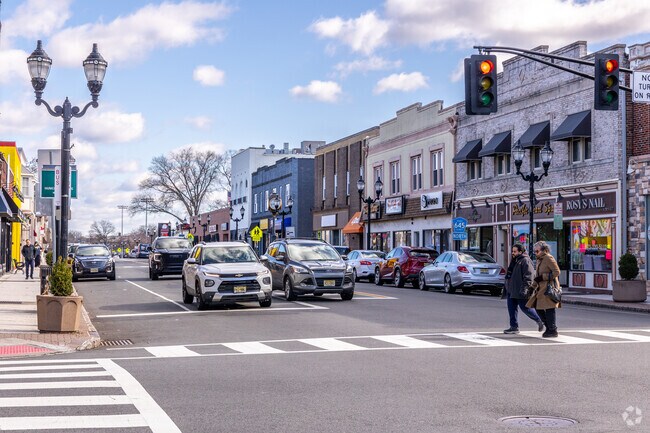
The township carries a strong sense of place rooted in its early-20th-century roots. Originally incorporated as Franklin Township in 1874, Nutley grew into a close-knit community with tree-lined streets and well-kept residential blocks that still define its character today. The Downtown district along Franklin Avenue anchors the social and commercial life of the area, while surrounding neighborhoods offer a quieter, more settled pace. The commuter-friendly location keeps demand steady, and the overall atmosphere rewards those who want proximity to New York City without sacrificing the ease of a smaller-town setting.
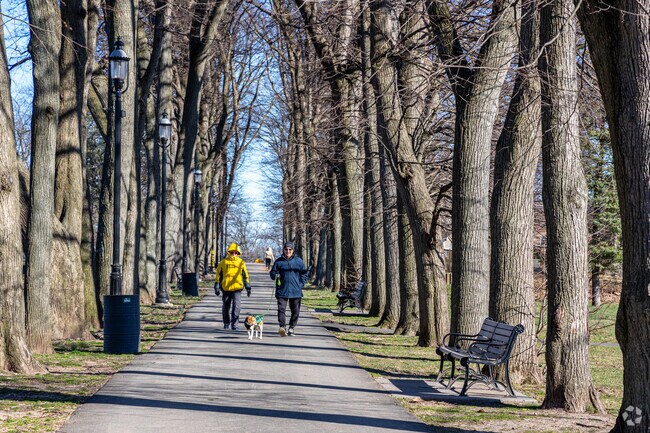
Nutley residents can discover tranquility in a suburban oasis at Yanticaw Park.
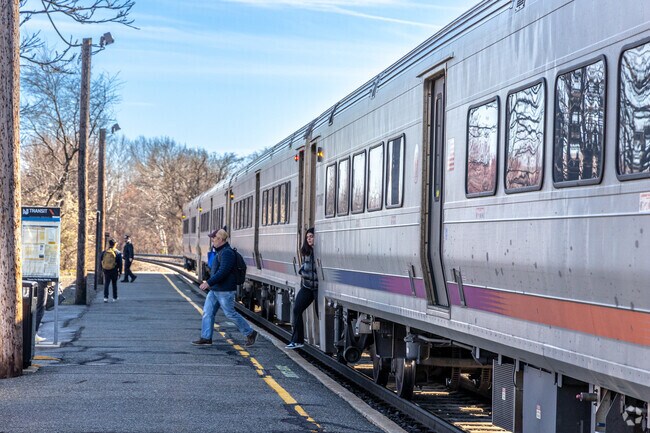
Nutley residents use NJ Transit at Delawanna Station to connect to the rest of New Jersey.
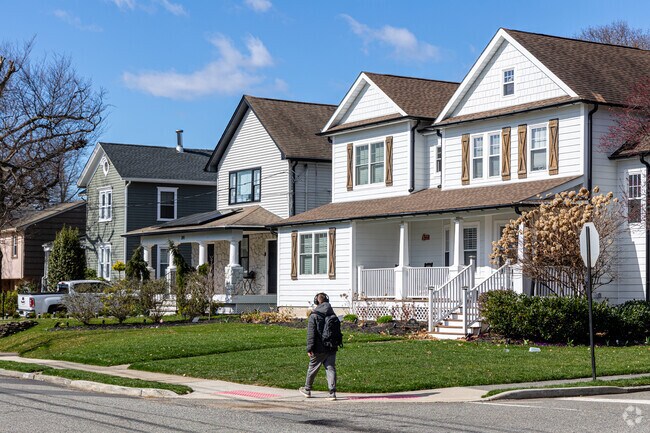
Most homes in Nutley feature large porches and expansive lawns.
Lenape Trail is a favored spot for Nutley locals to stroll with their furry companions.
Older students in Nutley attend Nutley High School, which received a B-plus rating from Niche.
Kingsland Park has many wrought iron and wood bridges connecting the grounds from the river.
Median Household Income
$105,200
Average: $133,034
Education
11,583
Residents Have a Degree
Job Market
16,526
Workers Employed
Median Age
43 Years
Largest Age Group
40-49 Years
Approximately 15% of Residents
Under 20
22%
Over 65
20%
Housing Distribution
Nutley has more homeowners than renters.

Education Distribution
Review this city's overall education levels.

As of July 2026, the average apartment rent in Nutley, NJ is $1,556 for a studio, $1,974 for one bedroom, $2,543 for two bedrooms, and $2,521 for three bedrooms. Apartment rent in Nutley has increased by 3.1% in the past year.
Explore how walkable, bikeable, drivable, and transit-friendly Nutley, NJ is for everyday living.
Moderately Walkable
Walkability
Limited Public Transit
Transit
Moderately Drivable
Drivability
Moderately Bikeable
Bikeability
Public
Grades PK-5
512 Students

Public
Grades PK-5
534 Students

Public
Grades K-5
342 Students
Spring Garden Elementary School
Public
Grades PK-5
606 Students

Public
Grades K-5
436 Students

Public
Grades PK & 6-8
637 Students
Public
Grades 9-12
1,222 Students

† Our analysis of utilities, groceries, transportation, healthcare, home prices, and other goods and services is sourced from the Cost of Living Index, a respected benchmark published by the Council for Community and Economic Research (C2ER) that provides a thorough overview of living expenses across different regions.
Rent data is provided by CoStar Group’s Market Trend reports. As the industry leader in commercial real estate information, analytics, and news, CoStar conducts extensive research to produce and maintain a comprehensive database of commercial real estate information. We combine this data with public record to provide the most up-to-date rental information available.
Consumer goods, services, and home prices are sourced from the Cost of Living Index published by the Council for Community and Economic Research (C2ER). The data on this page is updated quarterly. It was last published in June 2026.
Demographic information comes from Neustar and combines detailed address data with U.S. Census and American Community Survey statistics to produce reliable local estimates.


