Median Age
39 Years
Largest Age Group
40-49 Years
Approximately 15% of Residents
Under 20
26%
Over 65
14%
Area Guide
Avg Rent
$1,519
Population
61,852
Renter Mix
29% Rent
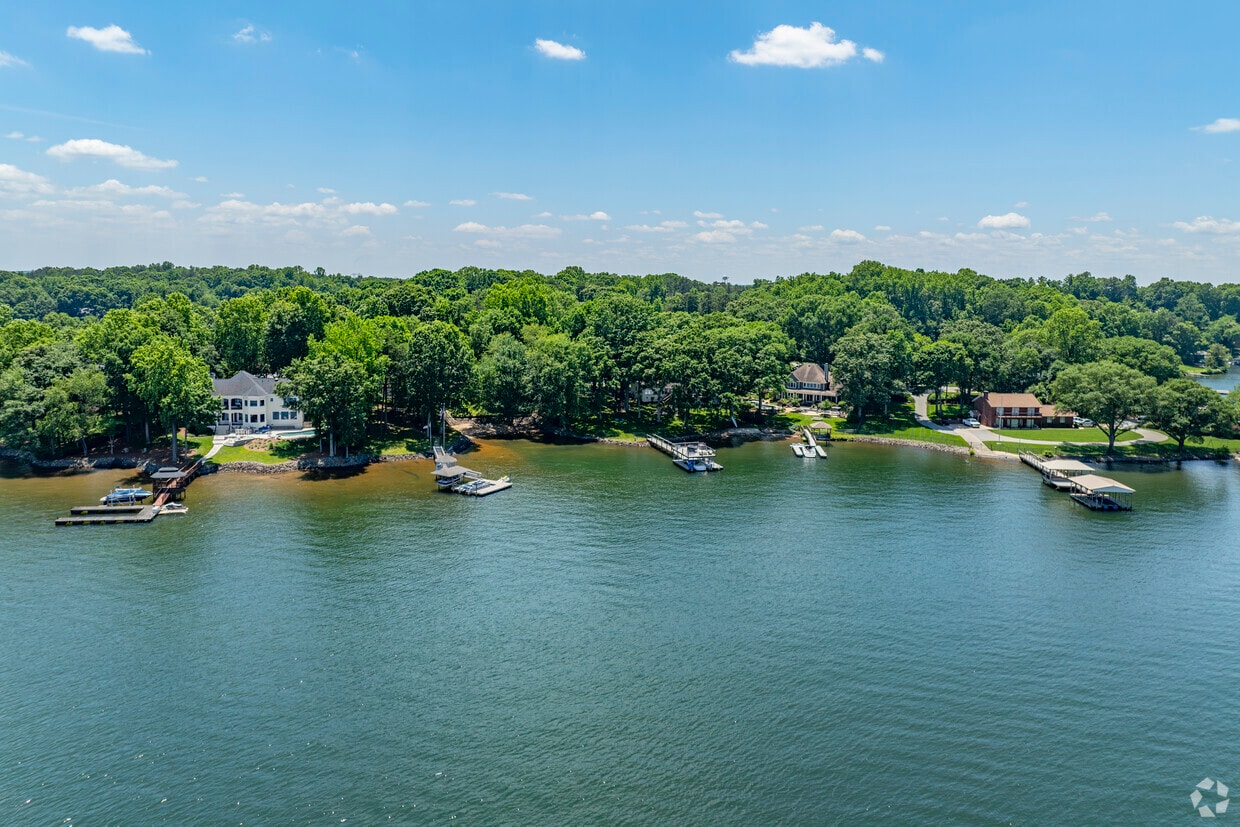
Located 14 miles north of Charlotte, Huntersville combines lakeside recreation with suburban living. Home to more than 64,000 residents, the area offers housing options from Lake Norman waterfront properties to downtown apartments. The rental market reflects steady demand, with monthly rates from $1,460 for studios to $2,192 for three-bedroom homes. The walkable Birkdale Village district features shops and restaurants, while downtown Huntersville preserves its historic character.
Lake Norman and Mountain Island Lake provide opportunities for boating and water activities throughout the year. Recreation options include NorthStone Country Club and Skybrook Golf Club, along with community parks like Huntersville Athletic Park and Veterans Park. Discovery Place Kids engages visitors with hands-on exhibits, while the Carolina Renaissance Festival transforms the area into a medieval village each fall. The presence of Joe Gibbs Racing adds to the area's motorsports connection. Lake Norman Charter School and the local public schools serve the community, while I-77's express lanes offer direct access to Charlotte.
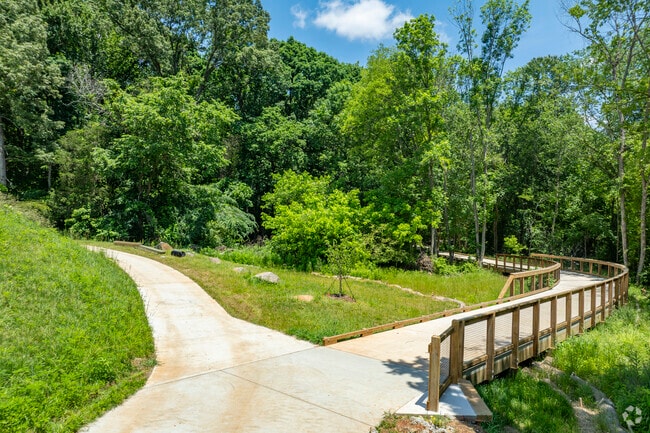
Torrence Hill Greenway has lots of options for journey through Huntersville.
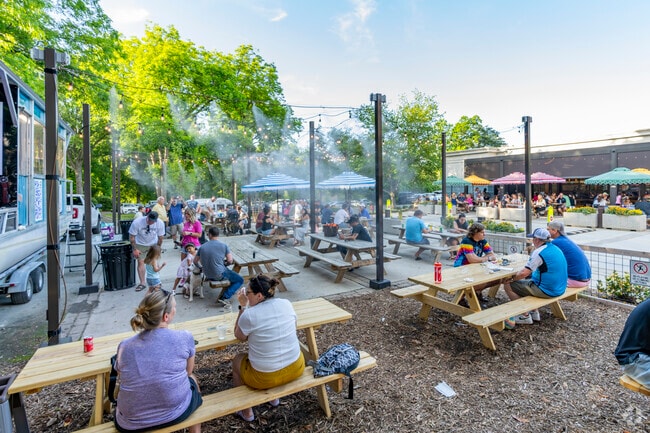
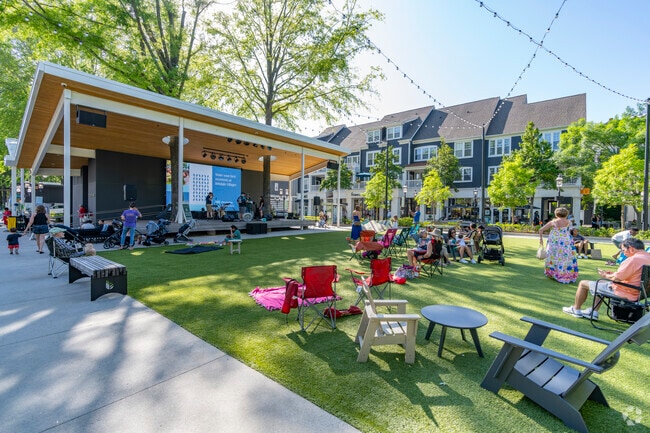
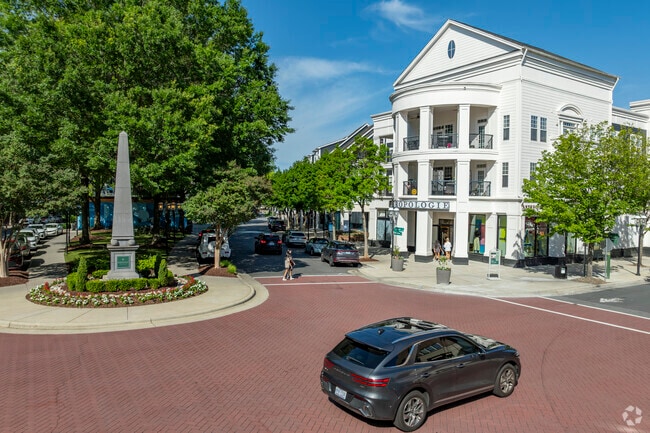
Huntersville locals can enjoy the amphitheater at popular Birkdale Village.
Birkdale Village features sidewalks throughout the area.
Live minutes from Lake Norman in Huntersville.
Large loading docks make a day on Lake Norman fun and easy at Blythe Landing Park.
The Torrence Creek Greenway is a well-loved, paved trail through Huntersville.
Median Household Income
$108,361
Average: $135,235
Education
25,835
Residents Have a Degree
Job Market
33,556
Workers Employed
Median Age
39 Years
Largest Age Group
40-49 Years
Approximately 15% of Residents
Under 20
26%
Over 65
14%
Housing Distribution
Huntersville has more homeowners than renters.

Education Distribution
Review this city's overall education levels.

As of July 2026, the average apartment rent in Huntersville, NC is $1,352 for a studio, $1,519 for one bedroom, $1,859 for two bedrooms, and $2,396 for three bedrooms. Apartment rent in Huntersville has decreased by -1.8% in the past year.
Explore how walkable, bikeable, drivable, and transit-friendly Huntersville, NC is for everyday living.
Somewhat Walkable
Walkability
Exceptionally Drivable
Drivability
Public
Grades K-12
2,215 Students

Public
Grades K-5
666 Students

Public
Grades K-5
479 Students
Public
Grades K-5
873 Students

Public
Grades PK-6
167 Students
Public
Grades K-12
2,215 Students
Public
Grades 6-8
1,097 Students
Bonnie Cone Leadership Academy
Public
Grades K-12

Public
Grades 6-8
783 Students

Public
Grades K-12
2,215 Students
Public
Grades 9-12
202 Students
Public
Grades 9-12
2,186 Students

Public
Grades 9-12
1,803 Students
Public
Grades 9-12
1,755 Students

† Our analysis of utilities, groceries, transportation, healthcare, home prices, and other goods and services is sourced from the Cost of Living Index, a respected benchmark published by the Council for Community and Economic Research (C2ER) that provides a thorough overview of living expenses across different regions.
Rent data is provided by CoStar Group’s Market Trend reports. As the industry leader in commercial real estate information, analytics, and news, CoStar conducts extensive research to produce and maintain a comprehensive database of commercial real estate information. We combine this data with public record to provide the most up-to-date rental information available.
Consumer goods, services, and home prices are sourced from the Cost of Living Index published by the Council for Community and Economic Research (C2ER). The data on this page is updated quarterly. It was last published in June 2026.
Demographic information comes from Neustar and combines detailed address data with U.S. Census and American Community Survey statistics to produce reliable local estimates.


