Median Age
47 Years
Largest Age Group
55-64 Years
Approximately 14% of Residents
Under 20
23%
Over 65
26%

Avg Rent
$2,404
Population
30,172
Renter Mix
19% Rent
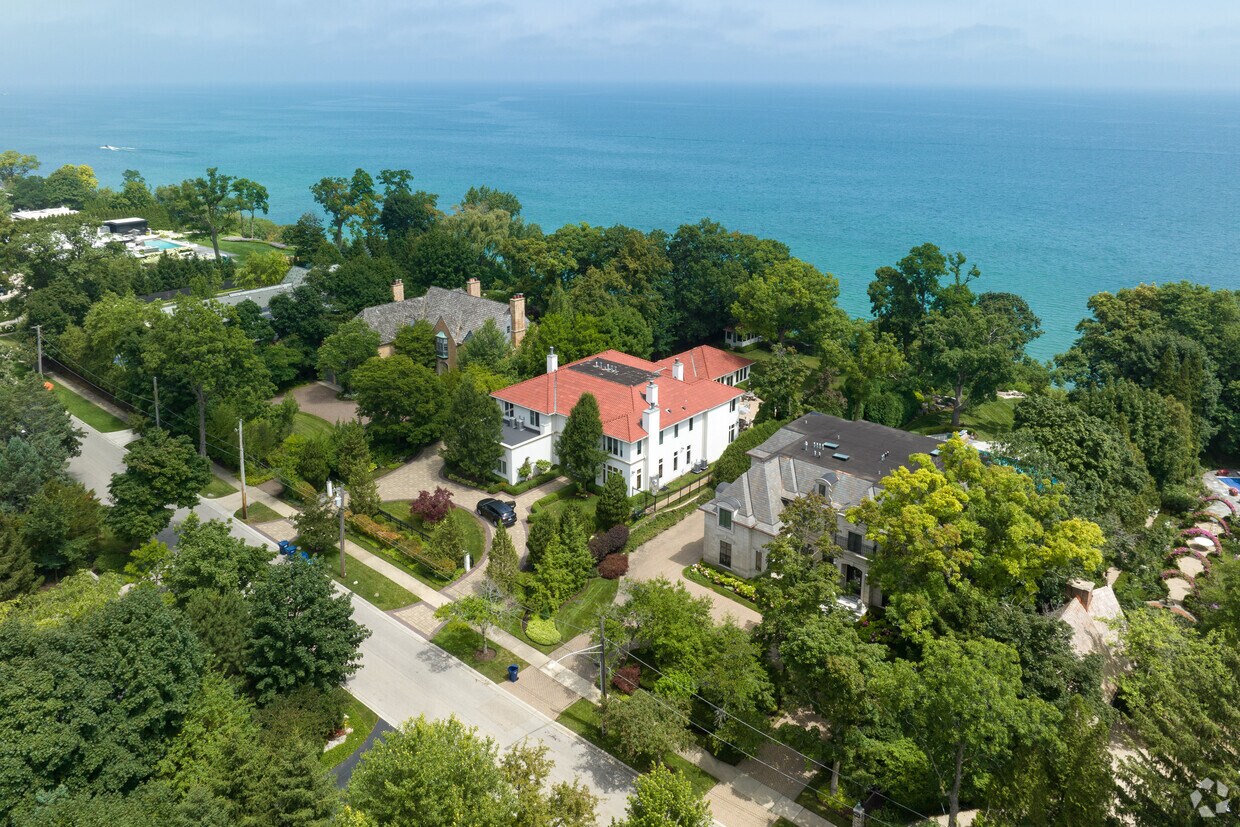
Situated along 6 miles of Lake Michigan shoreline about 25 miles north of downtown Chicago, Highland Park is a Lake County city of around 30,000 residents. Incorporated in 1869, the city is recognized for its wooded ravines, lakefront bluffs, a walkable downtown shopping district, and the Ravinia Festival, an open-air music venue that has been the summer home of the Chicago Symphony Orchestra since 1936. Renters searching for apartments in Highland Park will find a city that pairs easy access to Chicago with a strong local identity built around arts, architecture, and the Lake Michigan shoreline. Housing options here range from garden-style apartment communities and smaller walk-up buildings to mid-rise rentals near the downtown core. The Ravinia District, originally an artists' colony, features tree-lined streets and well-preserved early-20th-century architecture. The downtown stretch along Central Avenue and St. Johns Avenue is home to local restaurants, boutique shops, and cafes worth exploring. The city also has three public beaches — Rosewood Beach, Moraine Beach, and Park Avenue Beach — plus the Skokie Valley Trail for cycling and outdoor recreation. Several properties in Highland Park are listed on the National Register of Historic Places, including the Ward Willits House designed by Frank Lloyd Wright. Commuters have solid options here. Highland Park is served by four Metra Union Pacific North Line stations — Braeside, Ravinia Park, Ravinia, and Highland Park — with direct rail service into downtown Chicago in under an hour. US Route 41 runs through the city and connects to the broader metro highway network, and O'Hare International Airport is about 20 miles southwest. Pace bus routes round out local transit. Major employers in the North Shore corridor span healthcare, financial services, and corporate headquarters, with all of downtown Chicago's job market accessible by train. For renters who want North Shore living without sacrificing city access, Highland Park checks a lot of boxes.
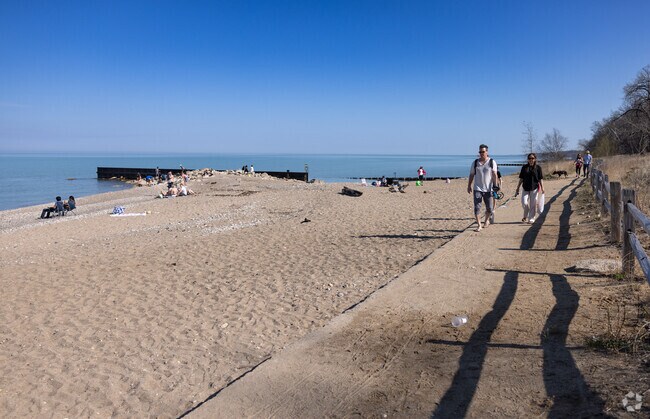
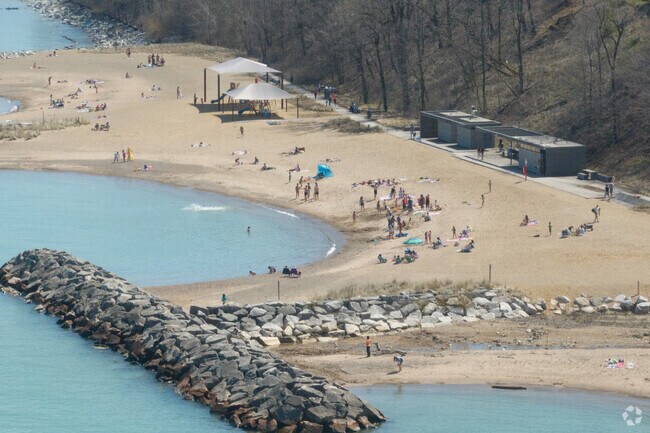
Rosewood Beach is a popular spot in Highland Park on a hot day.
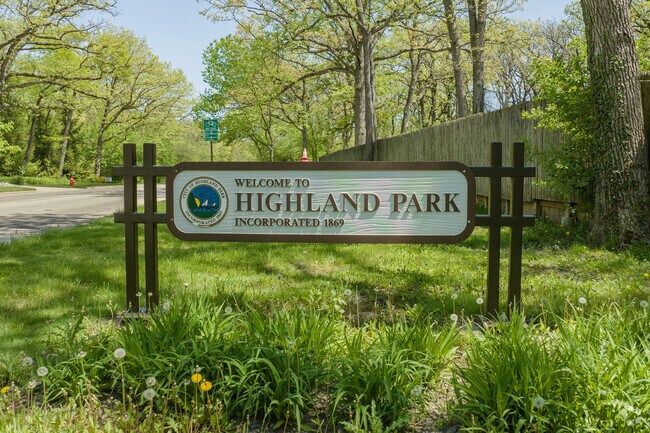
Highland Park was incorporated in 1869.
Highland Park dogs love a day at Moraine Beach where they can explore off-leash.
Sleepy Hollow Park is a nice place for locals to take a leisurely walk.
Fort Sheridan Forest Preserve offers walking trails but also offers a chance to learn history.
Metra train stations connect Highland Park residents to the rest of the Chicago metro area.
Median Household Income
$158,533
Average: $180,341
Education
17,711
Residents Have a Degree
Job Market
15,325
Workers Employed
Median Age
47 Years
Largest Age Group
55-64 Years
Approximately 14% of Residents
Under 20
23%
Over 65
26%
Housing Distribution
Highland Park has more homeowners than renters.

Education Distribution
Review this city's overall education levels.

As of July 2026, the average apartment rent in Highland Park, IL is $1,935 for a studio, $2,404 for one bedroom, $3,645 for two bedrooms, and $4,952 for three bedrooms. Apartment rent in Highland Park has increased by 3.8% in the past year.
Explore how walkable, bikeable, drivable, and transit-friendly Highland Park, IL is for everyday living.
Moderately Walkable
Walkability
Some Public Transit
Transit
Moderately Drivable
Drivability
Moderately Bikeable
Bikeability
Public
Grades K-5
279 Students

Public
Grades K-5
267 Students
Indian Trail Elementary School
Public
Grades K-5
459 Students

Public
Grades K-5
359 Students
Public
Grades K-5
225 Students
Public
Grades 6-8
653 Students
Public
Grades 6-8
534 Students
Public
Grades 6-8
300 Students

Public
Grades 6-12
Public
Grades 9-12
1,609 Students
Public
Grades 6-12
† Our analysis of utilities, groceries, transportation, healthcare, home prices, and other goods and services is sourced from the Cost of Living Index, a respected benchmark published by the Council for Community and Economic Research (C2ER) that provides a thorough overview of living expenses across different regions.
Rent data is provided by CoStar Group’s Market Trend reports. As the industry leader in commercial real estate information, analytics, and news, CoStar conducts extensive research to produce and maintain a comprehensive database of commercial real estate information. We combine this data with public record to provide the most up-to-date rental information available.
Consumer goods, services, and home prices are sourced from the Cost of Living Index published by the Council for Community and Economic Research (C2ER). The data on this page is updated quarterly. It was last published in June 2026.
Demographic information comes from Neustar and combines detailed address data with U.S. Census and American Community Survey statistics to produce reliable local estimates.


