Median Age
39 Years
Largest Age Group
30-39 Years
Approximately 14% of Residents
Under 20
25%
Over 65
17%

Avg Rent
$894
Population
24,029
Renter Mix
46% Rent
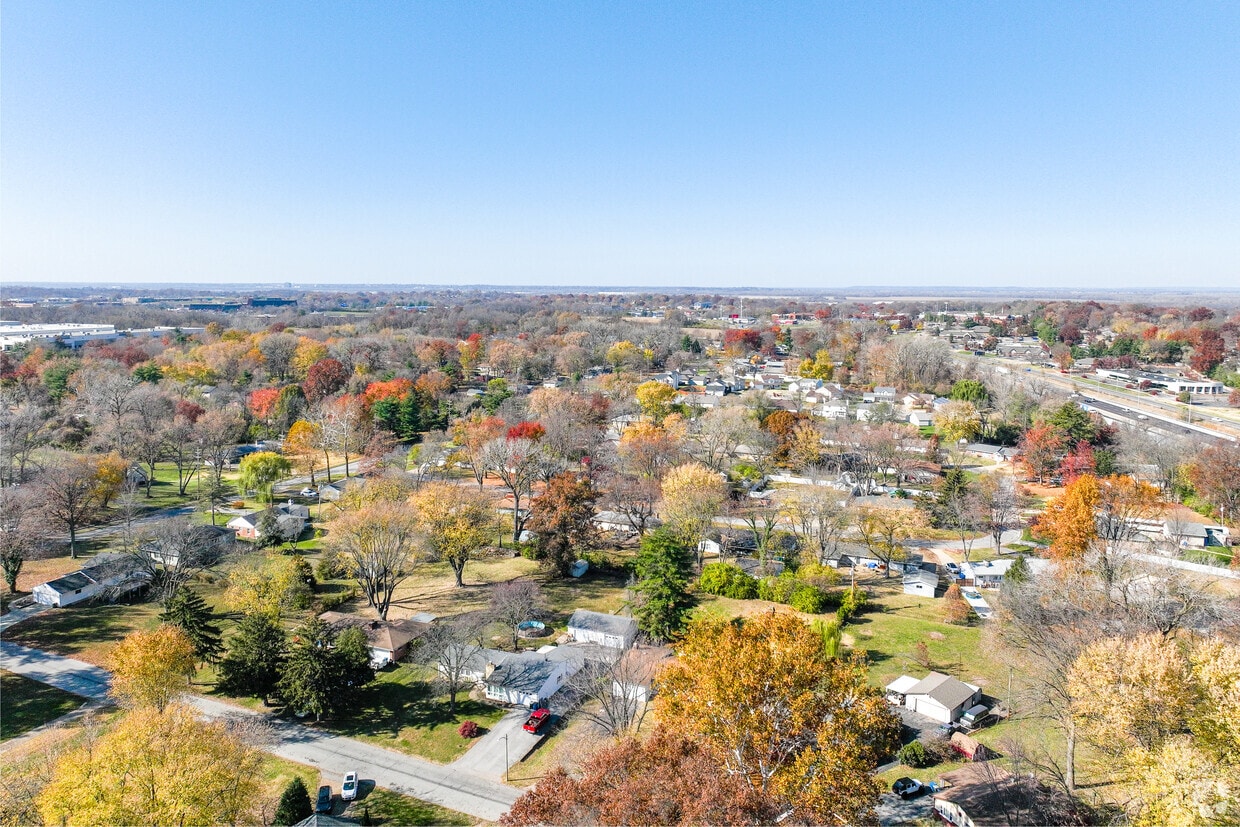
Hazelwood is a vibrant Saint Louis suburb situated just south of the Missouri River and just north of Saint Louis Lambert International Airport. Hazelwood is dynamic, containing bustling commercial centers and tranquil residential neighborhoods.
More than 1,000 businesses are located in Hazelwood, including 12 Fortune 500 companies and 10 corporate headquarters. Consequently, many Hazelwood residents enjoy short commute times and abundant shopping opportunities at the Saint Louis Outlet Mall.
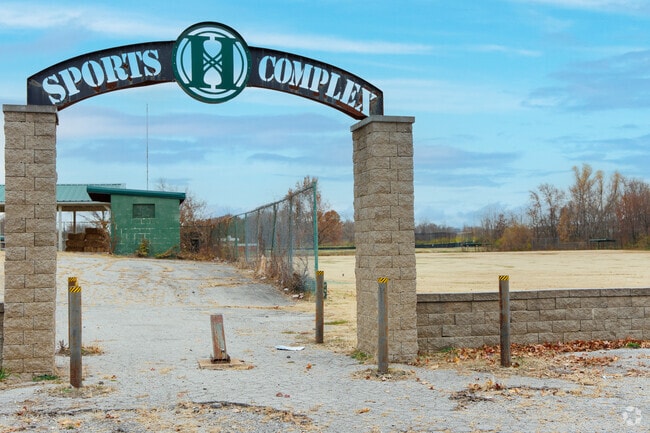
Hazelwood’s residential neighborhoods are truly picturesque, featuring stately homes and charming apartment buildings with manicured landscaping. Seventeen parks spanning over 179 acres contribute ample space for outdoor recreation in town. Commuting and traveling from Hazelwood is a breeze with convenience to I-170, I-270, and Saint Louis Lambert International Airport.
Residents of Hazelwood often enjoy taking leisurely strolls around the St. Stanislaus Conservation Area.
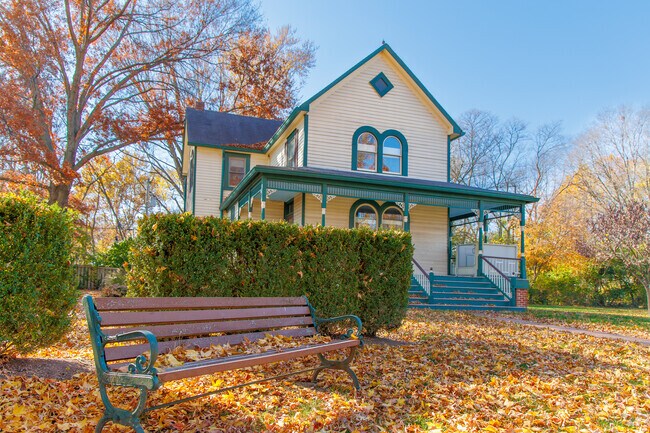
Brookes Park preserves historical buildings for the enjoyment of Hazelwood residents.
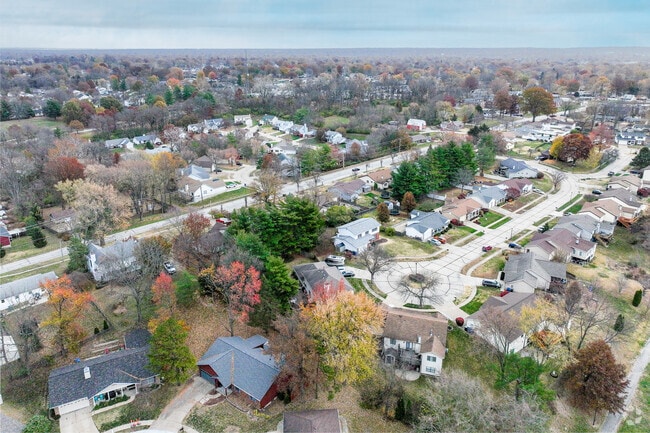
Homes line the cul-de-sacs and streets, creating a welcoming residential feel in Hazelwood.
Hazelwood residents love the selection at World Wide International Food Market.
Stop by Schnucks in Hazelwood for groceries.
Hazelwood residents are very close to Old Town Saint Charles and the annual holiday celebration.
Median Household Income
$54,030
Average: $66,262
Education
5,946
Residents Have a Degree
Job Market
12,467
Workers Employed
Median Age
39 Years
Largest Age Group
30-39 Years
Approximately 14% of Residents
Under 20
25%
Over 65
17%
Housing Distribution
Hazelwood has more homeowners than renters.

Education Distribution
Review this city's overall education levels.

As of July 2026, the average apartment rent in Hazelwood, MO is $898 for one bedroom, $1,113 for two bedrooms, and $1,290 for three bedrooms. Apartment rent in Hazelwood has increased by 3.8% in the past year.
Explore how walkable, bikeable, drivable, and transit-friendly Hazelwood, MO is for everyday living.
Somewhat Walkable
Walkability
Exceptionally Drivable
Drivability
Somewhat Bikeable
Bikeability
Public
Grades PK-5
326 Students

Public
Grades PK-5
309 Students
Public
Grades PK-5
417 Students

Public
Grades PK-5
401 Students
Public
Grades PK-5
361 Students
Public
Grades 6-8
245 Students
Public
Grades 6-8
730 Students

Public
Grades 6-8
724 Students
Public
Grades 9-12
2,042 Students

Public
Grades 9-12
1,994 Students
† Our analysis of utilities, groceries, transportation, healthcare, home prices, and other goods and services is sourced from the Cost of Living Index, a respected benchmark published by the Council for Community and Economic Research (C2ER) that provides a thorough overview of living expenses across different regions.
Rent data is provided by CoStar Group’s Market Trend reports. As the industry leader in commercial real estate information, analytics, and news, CoStar conducts extensive research to produce and maintain a comprehensive database of commercial real estate information. We combine this data with public record to provide the most up-to-date rental information available.
Consumer goods, services, and home prices are sourced from the Cost of Living Index published by the Council for Community and Economic Research (C2ER). The data on this page is updated quarterly. It was last published in June 2026.
Demographic information comes from Neustar and combines detailed address data with U.S. Census and American Community Survey statistics to produce reliable local estimates.


