Median Age
39 Years
Largest Age Group
30-39 Years
Approximately 14% of Residents
Under 20
26%
Over 65
18%


Avg Rent
$910
Population
50,203
Renter Mix
37% Rent
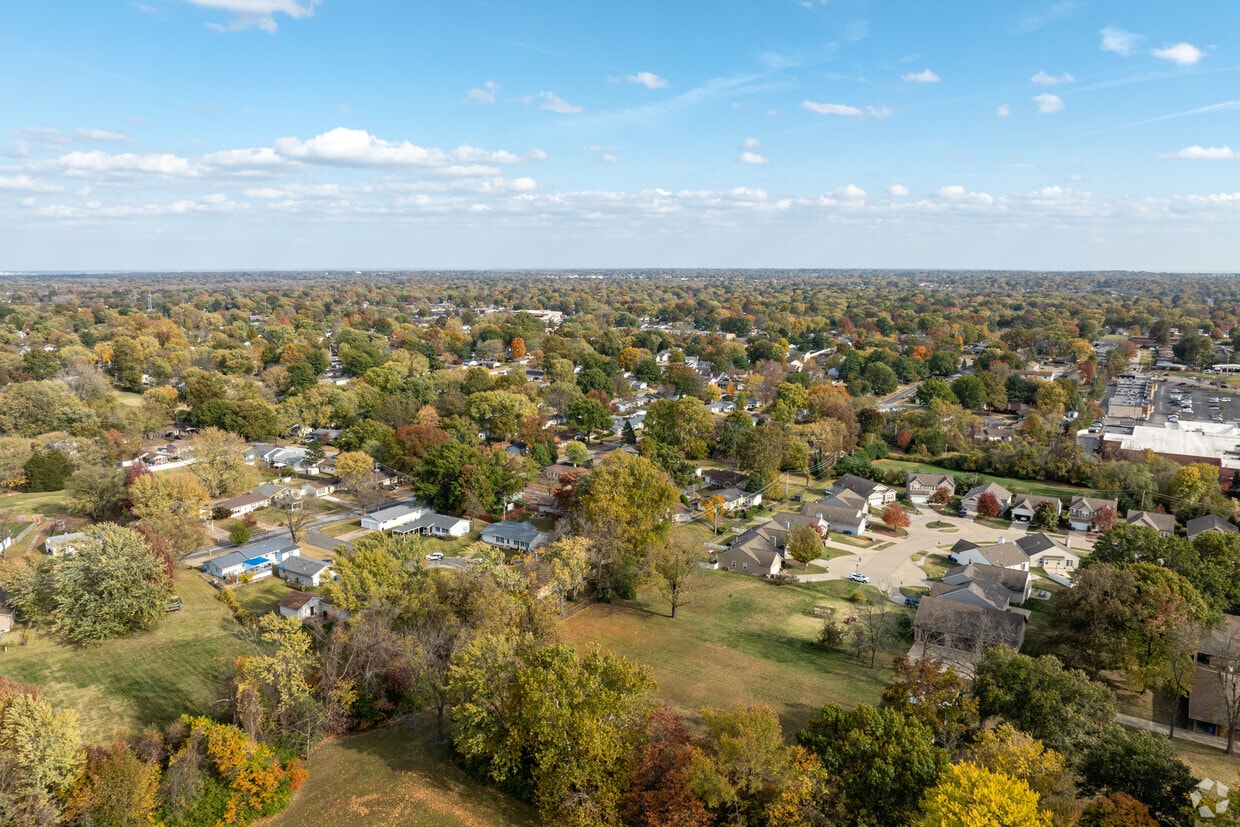
Situated about 15 miles northwest of Saint Louis, Florissant is a peaceful suburb brimming with historic charm and lush natural beauty. Florissant blends modern amenities with historic character, offering shopping options at brand-name retailers in the Shoppes at Cross Keys as well as independent boutiques in old-fashioned buildings in Old Town Florissant.
Old Town Florissant, the community’s historic downtown area, provides plenty of restaurants and service-oriented businesses in addition to its many unique shops. Residents flock to Old Town’s Saint Francois Street for an array of annual festivals and events, such as monthly Wednesday Nights Out events, the springtime Valley of Flowers Festival, and the Florissant Fall Festival.
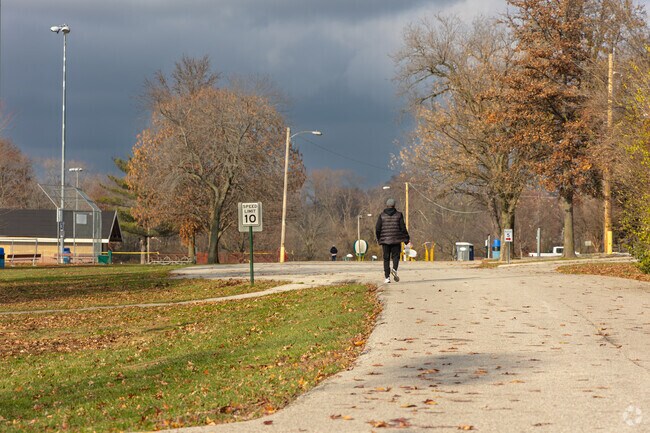
Bordering the Missouri River to the north, Florissant is ideally positioned for a variety of outdoor activities. Numerous scenic parks boast ample space for recreation, including Saint Ferdinand Park, Bangert Park, Koch Park, and Sunset Park. Florissant affords residents easy commutes and travels with access to U.S. 67, I-270, I-170, and Saint Louis Lambert International Airport.
Hike through the woods along the paved walking path at Sunset Park.
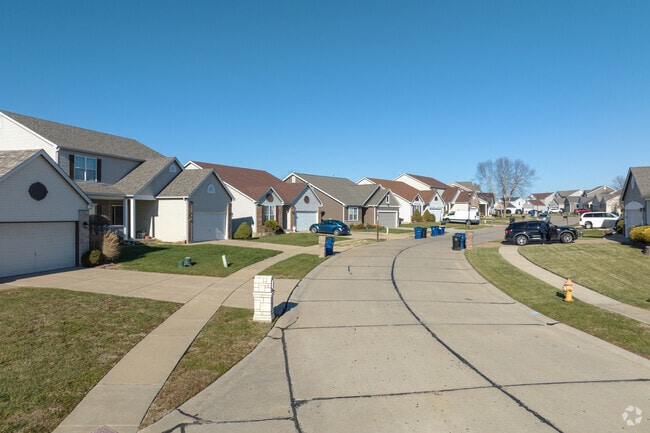
Florissant has new subdivisions for residents looking for new builds.
Median Household Income
$59,747
Average: $71,829
Education
10,403
Residents Have a Degree
Job Market
25,440
Workers Employed
Median Age
39 Years
Largest Age Group
30-39 Years
Approximately 14% of Residents
Under 20
26%
Over 65
18%
Housing Distribution
Florissant has more homeowners than renters.

Education Distribution
Review this city's overall education levels.

As of July 2026, the average apartment rent in Florissant, MO is $676 for a studio, $910 for one bedroom, $1,133 for two bedrooms, and $1,353 for three bedrooms. Apartment rent in Florissant has increased by 4.2% in the past year.
Explore how walkable, bikeable, drivable, and transit-friendly Florissant, MO is for everyday living.
Fairly Walkable
Walkability
Limited Public Transit
Transit
Exceptionally Drivable
Drivability
Somewhat Bikeable
Bikeability
Public
Grades K-8
307 Students

Public
Grades K-8
268 Students
Public
Grades PK-5
348 Students

Public
Grades PK-5
335 Students
Public
Grades PK-5
335 Students
Public
Grades K-8
307 Students
Public
Grades K-8
268 Students
Public
Grades 6-8
707 Students

Public
Grades 6-8
692 Students
Public
Grades 6-8
625 Students
Public
Grades 9-12
1,718 Students

Public
Grades 9-12
1,628 Students
Public
Grades 9-12
1,136 Students
Public
Grades 9-12
1,136 Students
Public
Grades 9-12
1,181 Students

† Our analysis of utilities, groceries, transportation, healthcare, home prices, and other goods and services is sourced from the Cost of Living Index, a respected benchmark published by the Council for Community and Economic Research (C2ER) that provides a thorough overview of living expenses across different regions.
Rent data is provided by CoStar Group’s Market Trend reports. As the industry leader in commercial real estate information, analytics, and news, CoStar conducts extensive research to produce and maintain a comprehensive database of commercial real estate information. We combine this data with public record to provide the most up-to-date rental information available.
Consumer goods, services, and home prices are sourced from the Cost of Living Index published by the Council for Community and Economic Research (C2ER). The data on this page is updated quarterly. It was last published in June 2026.
Demographic information comes from Neustar and combines detailed address data with U.S. Census and American Community Survey statistics to produce reliable local estimates.


