Median Age
35 Years
Largest Age Group
25-34 Years
Approximately 15% of Residents
Under 20
27%
Over 65
14%


Area Guide
Avg Rent
$1,959
Population
13,124
Renter Mix
58% Rent
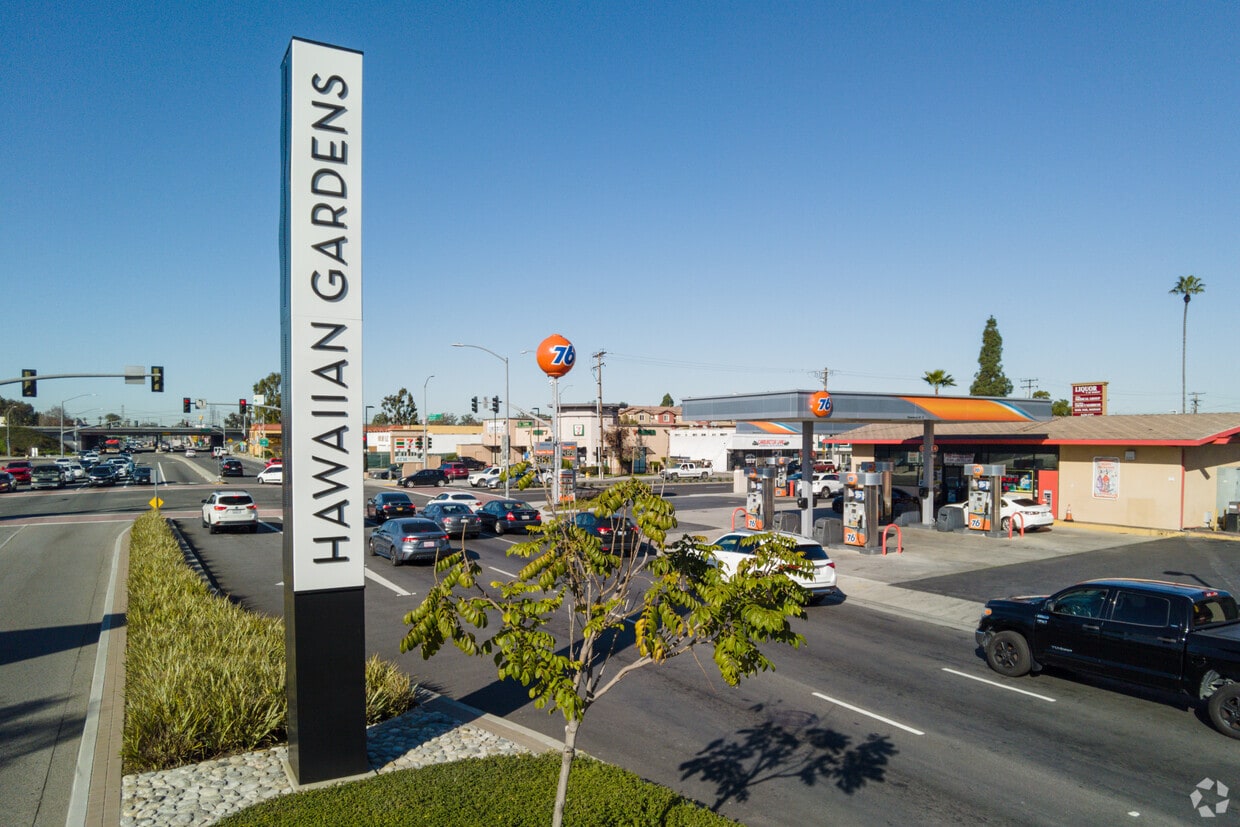
Hawaiian Gardens may be the smallest city in Los Angeles County, but its one square mile packs in more character than many places several times its size. Tucked into the southeast corner of L.A. County, bordered by Long Beach, Lakewood, and Cypress, this tight-knit community carries a surprisingly self-sufficient identity for a city that fits entirely within a single map grid square.
The Gardens Casino stands as the city's most recognizable anchor, generating the majority of municipal revenue and drawing visitors from across the region. That economic engine gives Hawaiian Gardens a distinct, locally-rooted personality that sets it apart from neighboring suburban cities. Proximity to the 605 freeway puts residents within easy reach of Long Beach, Cerritos, and the broader Los Angeles metro, making this compact city a practical base for those who work throughout Southern California. Long Beach City College and Cal State Long Beach are both a short drive away, adding an educational presence to the surrounding corridor and reinforcing the area's connection to one of Southern California's most active academic regions.
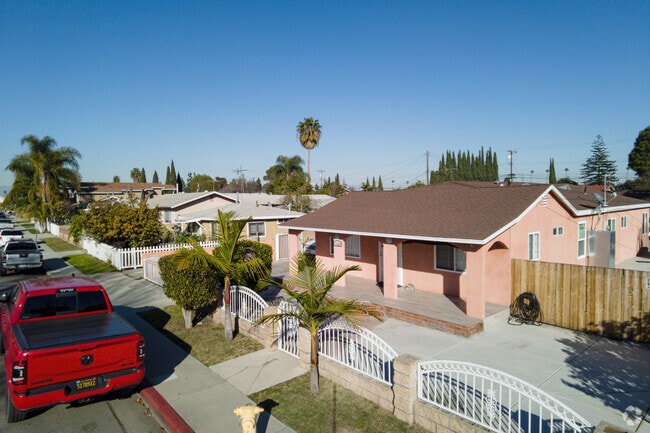
Homes in Hawaiian Gardens.
You will see some amazing vehicles at the Garden Grove Annual Car Show.
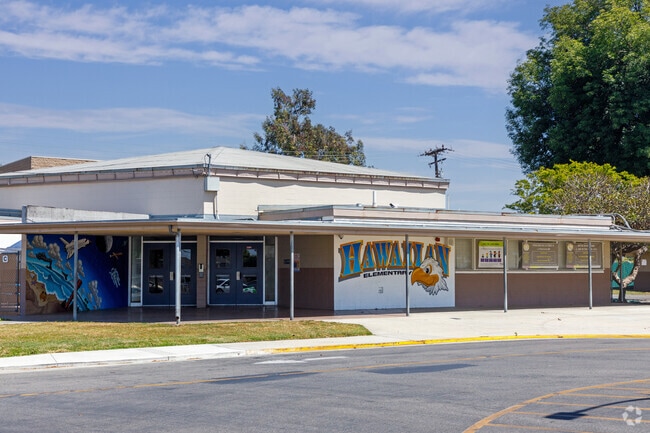
Hawaiian Elementary School, part of the ABC school district.
Homes in Hawaiian Gardens.
Skaters and bikers show tricks at Clarkdale Park in Hawaiian Gardens.
Artesia High School is a magnet school located in Lakewood.
Median Household Income
$67,545
Average: $78,097
Education
2,260
Residents Have a Degree
Job Market
6,392
Workers Employed
Median Age
35 Years
Largest Age Group
25-34 Years
Approximately 15% of Residents
Under 20
27%
Over 65
14%
Housing Distribution
Hawaiian Gardens has more renters than homeowners.

Education Distribution
Review this city's overall education levels.

As of June 2026, the average apartment rent in Hawaiian Gardens, CA is $1,959 for one bedroom, $2,207 for two bedrooms, and $2,453 for three bedrooms. Apartment rent in Hawaiian Gardens has increased by 1.6% in the past year.
Explore how walkable, bikeable, drivable, and transit-friendly Hawaiian Gardens, CA is for everyday living.
Moderately Walkable
Walkability
Some Public Transit
Transit
Exceptionally Drivable
Drivability
Moderately Bikeable
Bikeability
Public
Grades K-5
298 Students

Public
Grades K-5
298 Students
Furgeson (Venn W.) Elementary School
Public
Grades K-5
297 Students

Public
Grades K-5
297 Students
Public
Grades 6-8
291 Students
Fedde (Pharis F.) Middle School
Public
Grades 6-8
291 Students
† Our analysis of utilities, groceries, transportation, healthcare, home prices, and other goods and services is sourced from the Cost of Living Index, a respected benchmark published by the Council for Community and Economic Research (C2ER) that provides a thorough overview of living expenses across different regions.
Rent data is provided by CoStar Group’s Market Trend reports. As the industry leader in commercial real estate information, analytics, and news, CoStar conducts extensive research to produce and maintain a comprehensive database of commercial real estate information. We combine this data with public record to provide the most up-to-date rental information available.
Consumer goods, services, and home prices are sourced from the Cost of Living Index published by the Council for Community and Economic Research (C2ER). The data on this page is updated quarterly. It was last published in June 2026.
Demographic information comes from Neustar and combines detailed address data with U.S. Census and American Community Survey statistics to produce reliable local estimates.


