Median Age
43 Years
Largest Age Group
50-59 Years
Approximately 14% of Residents
Under 20
23%
Over 65
19%


Avg Rent
$2,384
Population
48,490
Renter Mix
33% Rent
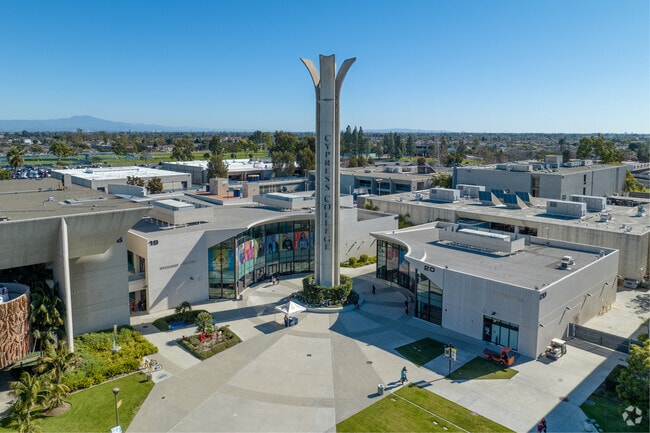
California dreaming is pretty accurate when describing the city of Cypress. Its proximity to major cities and destinations makes it a premier location to settle down with your family! This tight-knit, urban community is filled with a variety of single-family homes and apartments for rent, and the school system is well-respected. The Cypress School District thrives in this city, along with Cypress College. What are the conveniences that make this city so grand, you ask? Cypress is situated just eight miles west of Anaheim, 25 miles southeast of Los Angeles, and about 15 miles northeast of Long Beach and other nearby sandy shorelines. And as for entertainment destinations, Los Alamitos Race Course is situated in the city, and just a few miles outside of town, you’ll discover Adventure City and the famous Knott’s Berry Farm, a theme park known for its fried chicken.
And last, but definitely not least, Cypress is just seven miles west if Disneyland! In the city of Cypress itself, you’ll appreciate the number of community parks in town such as Veterans Park and Oak Knoll Park, along with local eateries like 7 Leaves Café.
Front entrance to Cypress College.
Median Household Income
$114,802
Average: $134,111
Education
18,914
Residents Have a Degree
Job Market
24,517
Workers Employed
Median Age
43 Years
Largest Age Group
50-59 Years
Approximately 14% of Residents
Under 20
23%
Over 65
19%
Housing Distribution
Cypress has more homeowners than renters.

Education Distribution
Review this city's overall education levels.

As of July 2026, the average apartment rent in Cypress, CA is $2,460 for a studio, $2,384 for one bedroom, $2,820 for two bedrooms, and $3,654 for three bedrooms. Apartment rent in Cypress has increased by 2.3% in the past year.
Explore how walkable, bikeable, drivable, and transit-friendly Cypress, CA is for everyday living.
Moderately Walkable
Walkability
Limited Public Transit
Transit
Moderately Drivable
Drivability
Moderately Bikeable
Bikeability
Public
Grades K-5
662 Students

Margaret Landell Elementary School
Public
Grades K-5
662 Students
Public
Grades K-5
650 Students
Frank Vessels Elementary School
Public
Grades K-5
650 Students
Juliet Morris Elementary School
Public
Grades K-5
562 Students

Public
Grades 6-12
1,315 Students
Public
Grades 6-8
1,188 Students

Public
Grades 6-8
1,188 Students

Public
Grades 9-12
2,685 Students
Public
Grades 9-12
2,685 Students
Public
Grades 6-12
1,315 Students
† Our analysis of utilities, groceries, transportation, healthcare, home prices, and other goods and services is sourced from the Cost of Living Index, a respected benchmark published by the Council for Community and Economic Research (C2ER) that provides a thorough overview of living expenses across different regions.
Rent data is provided by CoStar Group’s Market Trend reports. As the industry leader in commercial real estate information, analytics, and news, CoStar conducts extensive research to produce and maintain a comprehensive database of commercial real estate information. We combine this data with public record to provide the most up-to-date rental information available.
Consumer goods, services, and home prices are sourced from the Cost of Living Index published by the Council for Community and Economic Research (C2ER). The data on this page is updated quarterly. It was last published in June 2026.
Demographic information comes from Neustar and combines detailed address data with U.S. Census and American Community Survey statistics to produce reliable local estimates.


